
I remain focused on global central banks’ withdrawal of liquidity as the primary driver of markets this year, and in recent posts I’ve discussed how I think it’ll unfold. In short, I think we’re still in Phase 1, and it’s intensifying now as the dollar strengthens with higher interest rates in the US. Price action on Tuesday of this week was textbook Phase 1: stocks down, spreads wider, rates higher, volatility higher, and dollar stronger. While the data quality is weakening slightly, surprise indices are still positive, and as such, this tightening of financial conditions has yet to clearly impact the US data. I still think that arrives at some point soon, and that’ll be the opening salvo for Phase 2.
This week, I want to look more closely at what’s going on with USD liquidity from an offshore perspective. The onshore US financial conditions tightening we’re experiencing as Phase 1 appears to be affecting EM assets globally, and I believe the offshore dollar liquidity dynamics are the reason why. In this sense, EM is the canary in the coal mine for the offshore financial conditions tightening, which is partially a result of Fed actions, and could be exacerbated by trade tensions. Bottom line, offshore financial conditions tightening globally probably intensifies the effects outlined in the Three Phases model, but the international dynamics are complex, and only indirectly related to domestic US monetary policy tightening. I’m going to try to illustrate it anyway, with some simplification but hopefully not too much. My prior post, Cross Border Capital Flows: a Refresher on the Lingo, might serve as a reference if what follows sounds like mumbo jumbo.
The diagram below illustrates a hypothetical path of a dollar as it leaves the United States via the current account deficit, and eventually re-enters through the capital account surplus.
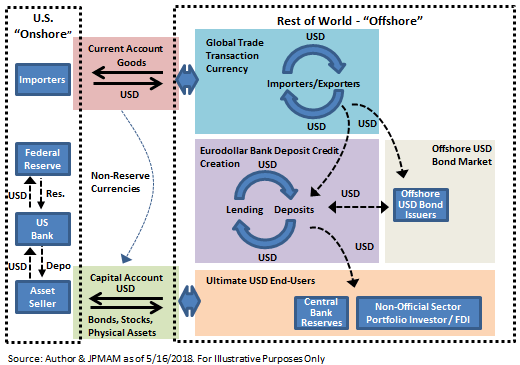
For countries who run current account deficits, but for whom there is no international demand for their currency as a reserve asset or medium of exchange, the entire right hand side of this diagram does not apply. Those countries purchase goods from abroad with their domestic currency, and that currency is immediately recycled back to the home country through the capital account (portfolio flow, foreign direct investment, or domestic central bank reserve depletion), because the currency in question has no offshore uses. The current account and the capital account must always balance for every country*, as in the “balance of payments.” However, for the USD as the most prominent reserve currency, there are many potential intermediate steps a dollar can take between its export through the current account, and its re-import through the capital account. In a nutshell the USD has offshore uses, which I try to show in a stylized fashion on the right hand side.
The USD is both the primary reserve asset for foreign central banks (orange box), as well as importantly, a preferred currency for global trade and international commerce (blue box). For both of these reasons, there is offshore demand for dollars as both a store of value as well as a medium of exchange. (Importantly, that demand is generally increasing over time, which we’ll come back to). Non-US banks commonly accept dollars on deposit, and in turn lend out those dollar deposits through traditional loans or dollar-denominated securities purchases (purple box). I label this the Eurodollar deposit market, though “Eurodollar” is often used more loosely. This is credit creation in the classical sense, where dollar supply originating purely from the US current account deficit acts like a monetary base, and then offshore USD bankdeposits are created through bank lending, which is synonymous with increasing the broader money supply. In parallel, non-US financials as well as sovereigns and non-US corporates issue dollar-denominated bonds in the offshore market (tan box). This isn’t credit creation per se, because deposits in the Eurodollar system do not increase through these transactions, but the issuers raise genuine dollar financing for reserve accumulation, trade finance, or in the case of “high carry” currencies, for speculation given typically lower dollar financing interest rates.
Ultimately, USD deposits find their way to an end-user (orange box) who for risk tolerance and/or regulatory reasons chooses to reinvest the USD back into US onshore assets through the capital account. Whether that investment takes the form of portfolio flows (Treasurys, corporate bonds, stocks), or foreign direct investment (real estate, factory ownership, etc.), the dollars end up as deposits in a US bank with bank reserves at the Fed as the asset held against it.
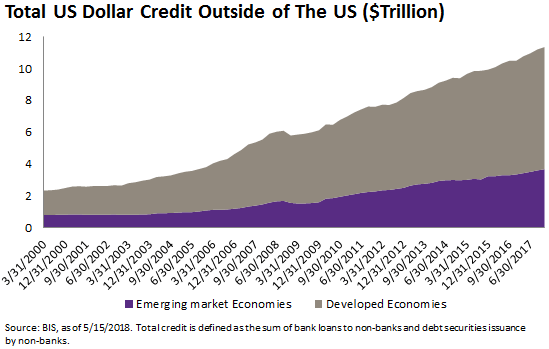
The key variables which drive supply and demand for offshore dollar liquidity are how many rotations each of these various components of the system cycle through. If global trade volumes or reserve demand increase, then there is greater demand for USD as the medium of exchange and store of value. In much the same way as a central bank balance sheet must generally increase over time to achieve positive nominal GDP growth and a positive inflation target (see the seashell analogy in Printing versus Burning), there must be a generally persistent current account deficit from the reserve currency country to satisfy expanding offshore reserve currency demand for trade growth. Secondly, the number of times a USD cycles through the Eurodollar deposit credit-creation mechanism before it reaches an end user who repatriates it to the US determines the supply of higher-order monetary aggregates offshore (think M1, M2). Thirdly, the size of the offshore USD bond market determines the need for dollar liquidity for ongoing repayments or ever-growing (re-)financing needs. The size is big:
Now, tightening financial conditions onshore in the US increases the attractiveness of domestic US investments all along the risk and maturity spectrum, when compared to offshore equivalents which are also USD-denominated. Borrowing money is more expensive, which means investing money is more lucrative. Higher risk-adjusted returns for onshore USD investments essentially encourage an interruption to the Eurodollar deposit credit creation cycle sooner, i.e. after a fewer number of rotations, an end-user is enticed to repatriate the dollars to a US bank directly or via a US investment, which ultimately reduces broad money supply growth of USD deposits offshore. I believe this is starting to occur, and this drives up the USD exchange rates.
Emerging market borrowers across sovereigns, banks, and non-financial corporates, have been material issuers in the international USD bond markets, as represented in the chart above. A noticeable reduction of offshore dollar liquidity supply with no change in demand encourages capital to flow out of EM currencies and into dollars, especially when the countries in question have significant dollar liabilities. This is occurring, and is why the EM FX price action can serve as a canary in the coal mine for pressure in offshore USD liquidity.
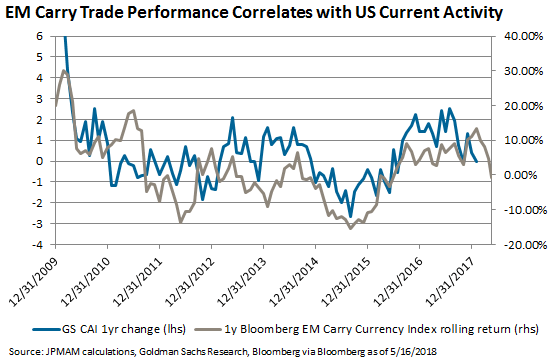
I expect the offshore liquidity challenges will potentially intensify the impact of tightening US financial conditions, by providing a conduit for the monetary policy to extend globally. Interestingly, if EM FX is the canary for offshore dollar liquidity, it seems to correlate pretty well to changes in contemporaneous onshore US economic activity:
Finally, if efforts on the part of the Trump administration to reduce the US trade deficits are successful, the offshore supply of pure USD – the monetary base for global trade and reserves—will be curtailed. I expect if this were to occur, the price of offshore dollar bonds would be quite sensitive, given the large outstanding stock. So rather than just EM FX coming under pressure and the dollar rallying, you’d see actual deleveraging needs in the offshore USD debt markets.
*This is theoretically true, but there are reasons why the balance of payments may not balance in a given fixed time period, or may not balance over time if there is significant smuggling or other forms of shadow trade and investment occurring off the books. For purposes of my illustration here, I stick to the theory for simplicity.