Cash Trap
Market Views from the Global Fixed Income, Currency & Commodities (GFICC) group
21-06-2023
At inflection points, the outlook can appear especially uncertain leaving investors feeling trapped. Today, it feels like we may be approaching one of these forks in the road.
Central banks have been aggressively fighting high inflation for over a year. Leading the charge in the developed world has been the Federal Reserve (Fed) which has raised the Fed Funds Rate an eye watering 500bps in 15 months. The result has been negative real residential investment for eight straight quarters, contractionary ISM manufacturing since October 2021, and the most negative Conference Board’s Leading Indicator outside of recession. While jobless claims have bottomed and are creeping higher, payrolls growth continues to clock in well above-average (283k over the last three months). And despite a pause in June, Federal Open Market Committee (FOMC) members seem unsatisfied as core inflation remains over 300bps above the Fed’s 2% target. Although the three-month annualized rate of core PCE inflation (the Fed’s preferred metric) has decelerated from 6.7% in June 2021 to 4.3% in the latest reading, the Fed had perhaps hoped for more.
These conflicting and confusing signals present a dilemma, brightening the allure of cash, which now yields above 5%. To be clear, when we say cash in this conversation, we mean three-month Treasury bills. In contrast, the average rate on a savings account is still just 0.25% according to Bankrate’s June 14th weekly survey. To further complicate the picture, the yield curve is currently inverted meaning two-year, five-year, ten-year, and thirty-year Treasury yields are all below the current three-month bill rate.
This begs the question: why extend into any fixed income duration at all, particularly when 2022 provided such poor results? Simply put, the 5% return promised by cash can only be achieved if the policy rate stays above 5% for the next year because every three months, you will need to reinvest your proceeds at the prevailing market rate. If three-month yields are the same or even higher, you are in luck for another three months. But, if they are lower, you may have fallen into the cash trap. Typically, once the Fed starts cutting—based on the last six cycles—they cut an average of ~200bps within the first year.
Timing any inflection point, whether it be the exact month we head into recession or when the Fed starts cutting is a challenging task, but we do have guideposts that suggest we are close. Real policy rates are turning positive for the first time in the cycle and yield curves have been significantly inverted for over six months. When the spread between the three-month bill rate and the ten-year US Treasury yield reaches peak inversion, recession usually follows shortly after. Following this specific yield curve also allows you to identify the soft landings in 1984 and 1995 where the Fed hiked about ~300bps in both cases, the curve did not invert, and a recession did not result.
3mo Bill Rate vs. 10yr UST Treasury Yield
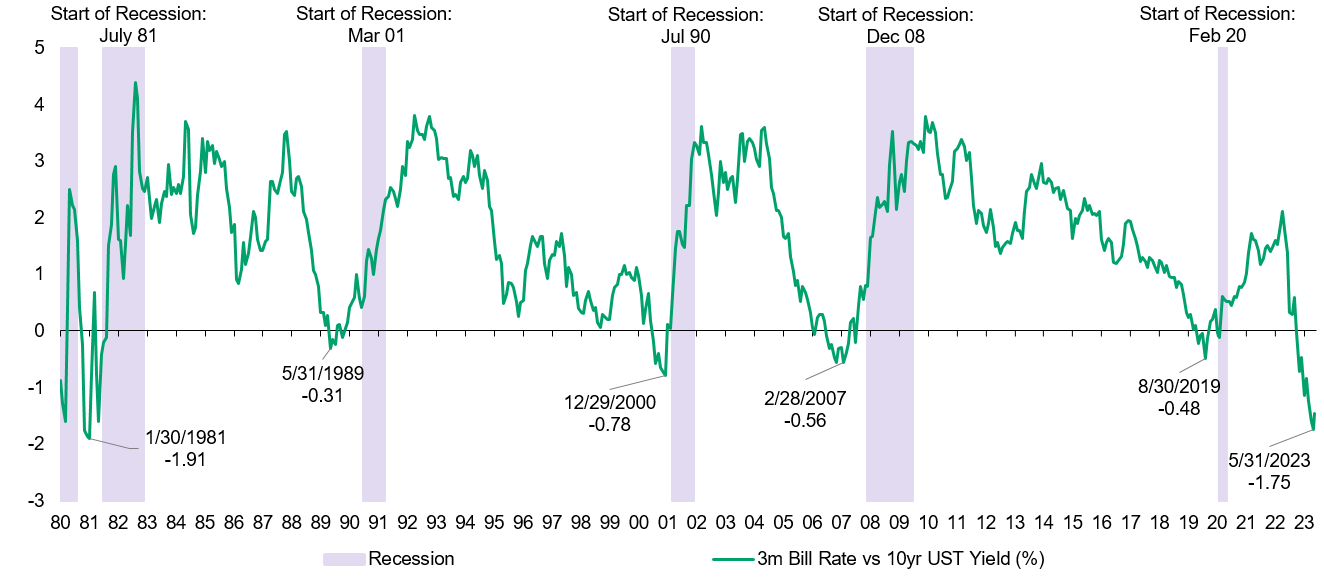
Source: Bloomberg, J.P. Morgan. As of June 16th , 2023.
Last month, this curve was inverted by -175bps, which is the most since the 1980s (coincidentally the 1980s was also the last time the Fed raised rates this aggressively). Historically, at every peak inversion in the yield curve since the 1980s, bonds have outperformed cash over the subsequent two years.
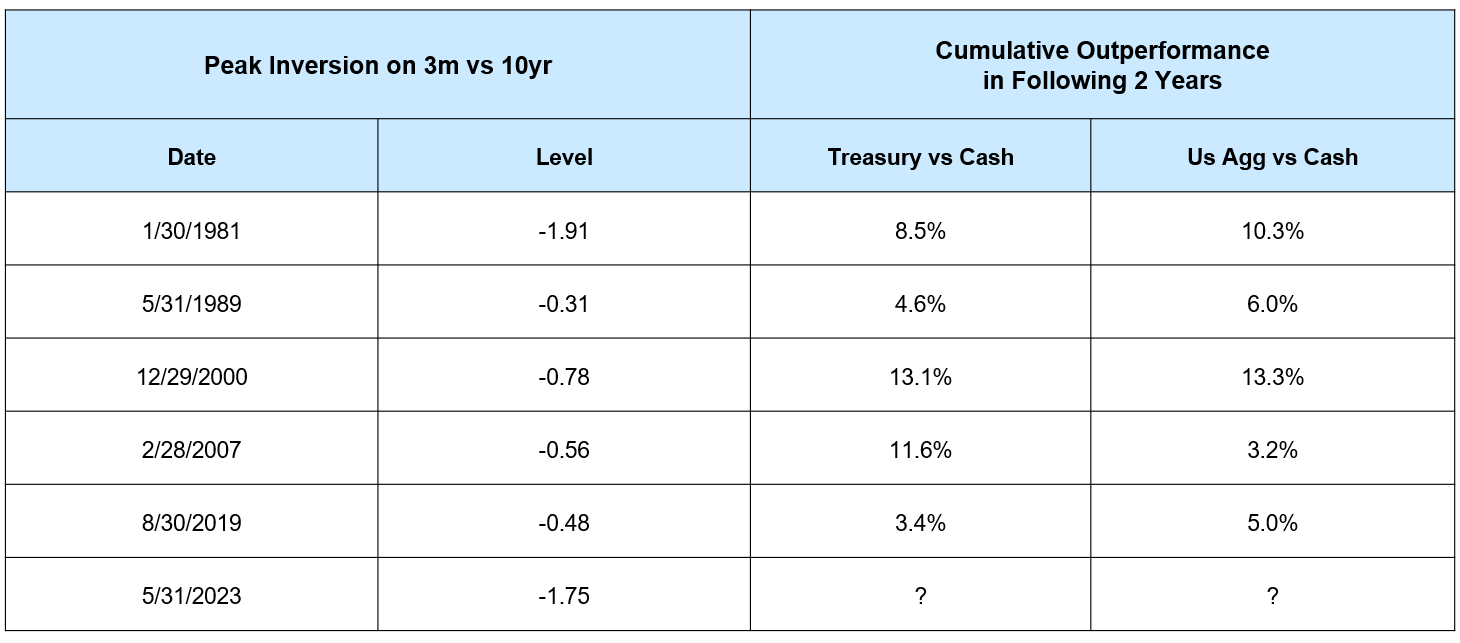
Peak inversion determined using monthly time series
Cash: ICE BofA 3-Month Treasury Bill Index, US Agg: Bloomberg US Aggregate Index, Treasuries: Bloomberg US Treasury Index
All returns are cumulative using monthly time series
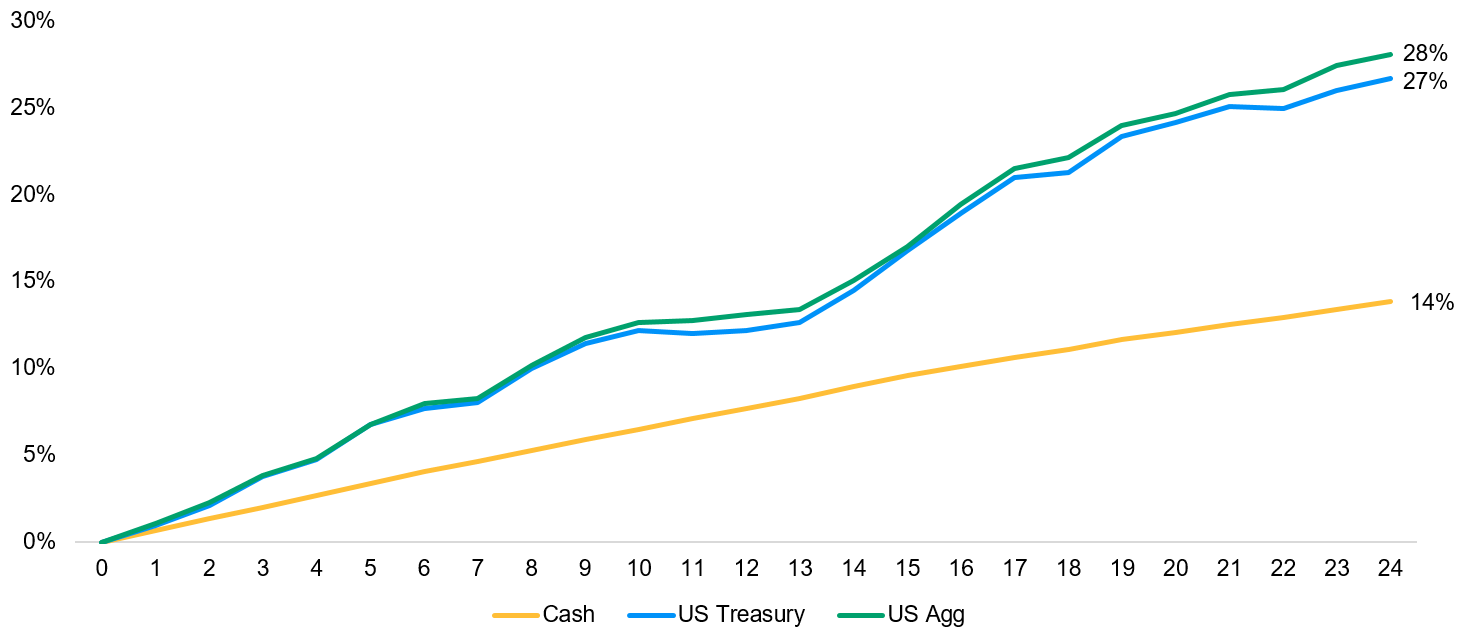
However, the path forward is not always a straight line. In the first six months after peak inversion, outperformance only emerged in three out of the five cycles but within a year, bonds tended to consistently return more than cash.
Average Cumulative Performance Once 3m10y Yield Curve Reaches Peak Inversion in Last 5 Cycles
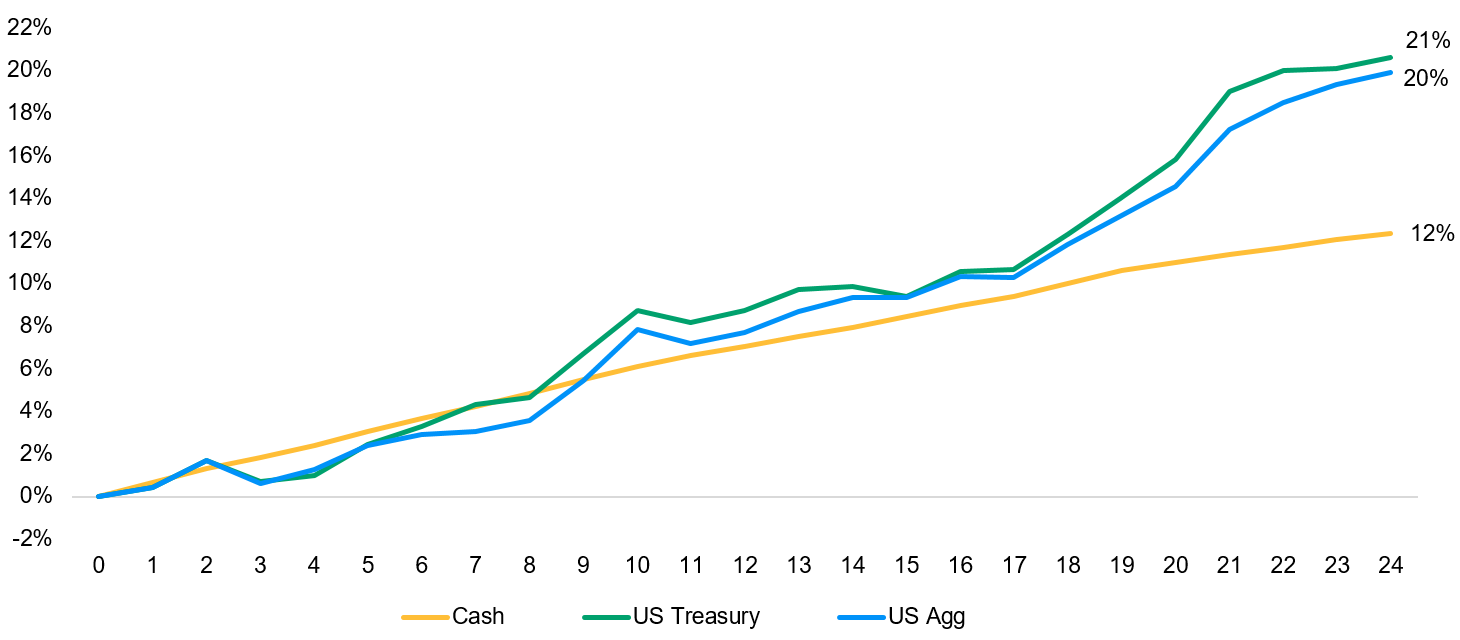
Notes:
Cash: ICE BofA 3-Month Treasury Bill Index, US Agg: Bloomberg US Aggregate Index, Treasuries: Bloomberg US Treasury Index
Monthly cumulative returns
5 Cycles: Jan 1981, May 1989, Dec 2000, Feb 2007, Aug 2019
If you also add in the cycles where the yield curve did not invert and there was no recession, but rather the Fed was able to engineer a soft landing, a similar picture emerges: bonds outperformed cash in all 7 instances in the two years following the Fed’s last rate hike.
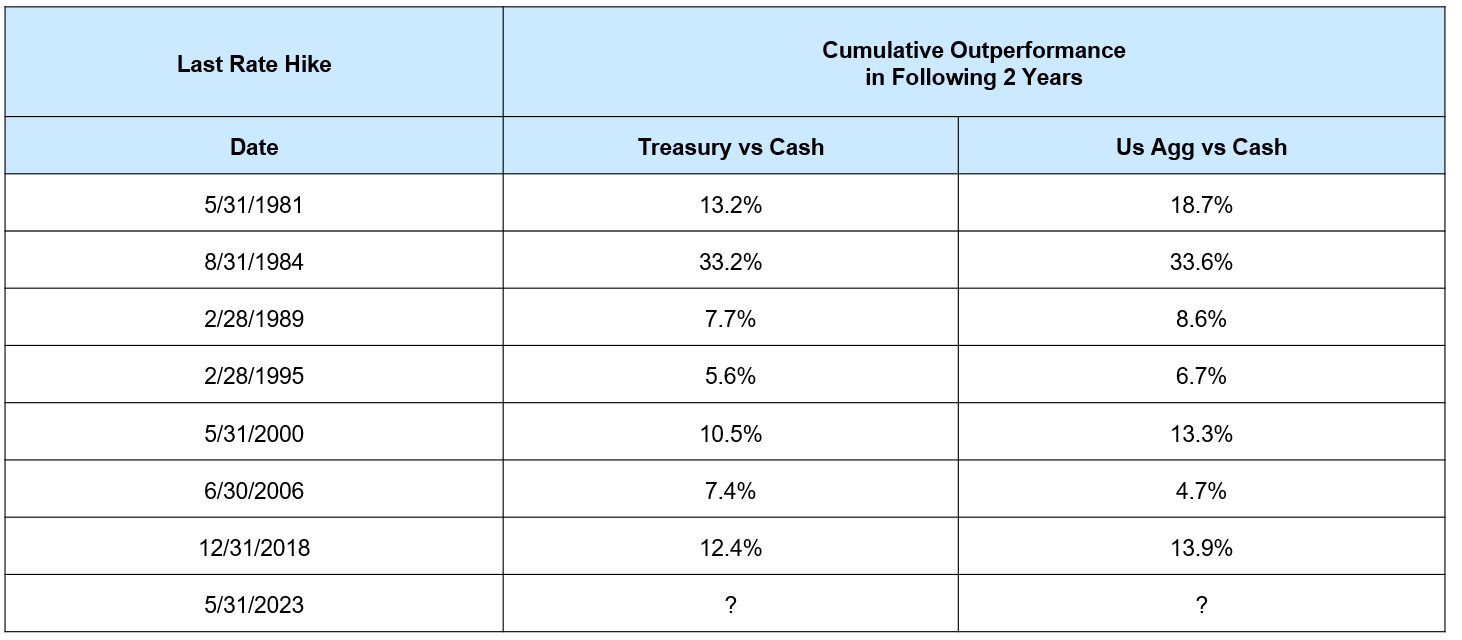
Cash: ICE BofA 3-Month Treasury Bill Index, US Agg: Bloomberg US Aggregate Index, Treasuries: Bloomberg US Treasury Index
All returns are cumulative using monthly time series
Average Cumulative Performance after the Last Rate Hike in Last 7 Cycles
Notes:
Cash: ICE BofA 3-Month Treasury Bill Index, US Agg: Bloomberg US Aggregate Index, Treasuries: Bloomberg US Treasury Index
Monthly cumulative returns
7 cycles: 1981, 1984, 1989, 1995, 2000, 2006, 2018
While the path forward remains uncertain, the yield curve is historically inverted, which suggests the end of the Fed’s hiking cycle is on the horizon. As a result, using history as a road map should lead investors to embrace high quality fixed income, rather than shying away from it.
09yu232006174113