Large institutional and individual retail investors are increasingly demanding that the stewards of their savings take environmental, social and governance (ESG) factors into account—aiming to make poor performance on ESG fronts impose a higher cost of capital on bad actors.1 Today third- party firms provide ESG ratings for fund managers to help make this possible.2 We set out to test how these ratings work in practice, through a study that uses a quantitative approach overlaying MSCI ESG scores on investment grade (IG), high yield (HY) and emerging market (EM) bonds.3
Our study asks: How different are ESG scores from traditional agency credit ratings? Are E, S and G scores correlated to one another? Most importantly, can ESG scores enhance the investment process? Can an active, ESG-tilted bond portfolio strategy generate superior performance vs. a relevant benchmark that does not explicitly take ESG scores into account?
After controlling for sector, rating and duration, we find that the gross returns of ESG-tilt strategies are either comparable to, or higher than, those of their relevant ESG sector benchmarks. In the IG space, this holds true net of typical transaction costs. However, after we applied a turnover-slowdown methodology4 and trading costs to the HY and EM categories, the active ESG-tilt strategy net returns were lower than those of their respective ESG benchmarks.5
We conclude that ESG scores can be utilized to enhance portfolio outcomes via lower drawdowns, reduced portfolio volatility and, in some cases, marginally increased risk-adjusted returns. Our back-testing suggests that MSCI scores are additive to traditional credit ratings; the contingent liabilities related to ESG issues are not necessarily factored into rating agencies’ assigned ratings.
How do ESG ratings differ from traditional agency ratings?
We assessed the correlations among each of the E, S and G scores—for investment grade, high yield and emerging market bond issuers—with their associated agency ratings (testing historical monthly, cross-sectional correlations). Our results show low levels of correlation, indicating that these information sets are relatively distinct. It seems that credit agencies do not necessarily fully factor into their assigned ratings the liabilities related to ESG.
The governance score, in particular, has a persistently low correlation with agency ratings, especially in the IG space, where it has been persistently negative since March 2015. Correlations between credit ratings and environmental scores, on the other hand, have generally been the most positive over the past five years. This could imply that companies with stronger balance sheets, which tend to be highly rated, are better positioned to address their environmental obligations.
Are ESG scores correlated to one another?
ESG scores are derived from three distinct pillars of information: environmental, social and governance. To what extent do these pillars differ in informational content? Truly distinct information sets would have low levels of correlation with one another. We assessed the historical monthly, cross-sectional correlations among the E, S and G scores of IG, HY and EM bond issuers.
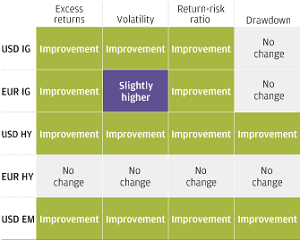
Summary of findings (gross): Back-testing a systematic ESG tilt in corporate bond investing
EXHIBIT 1: ESG-TILTED ACTIVE STRATEGIES VS. CUSTOMIZED ESG BENCHMARKS GROSS OF TYPICAL TRANSACTION COSTS (IG, HY AND EM)

Source: USD and EUR ICE Bank of America-Merrill Lynch Global High Yield, Global Corporate and Emerging Markets Corporate Plus indices; MSCI ESG Research; J.P. Morgan Asset Management Global Fixed Income, Currency & Commodities Quantitative Research Group; data as of March 31, 2019.
Note: ESG-tilt strategies are all controlled for market sector, rating and duration.
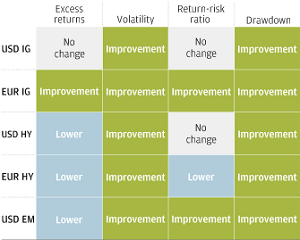
EXHIBIT 2: ESG-TILTED ACTIVE STRATEGIES VS. CUSTOMIZED ESG BENCHMARKS NET OF TYPICAL TRANSACTION COSTS (IG, HY AND EM)

Source: USD and EUR ICE Bank of America-Merrill Lynch Global High Yield, Global Corporate and Emerging Markets Corporate Plus indices; MSCI ESG Research; J.P. Morgan Asset Management Global Fixed Income, Currency & Commodities Quantitative Research Group; data as of March 31, 2019.
Note: ESG-tilt strategies are all controlled for market sector, rating and duration.
Broadly speaking, the correlations among the scores were significantly positive until early 2010, after which they began to decline to around zero. Although there was high commonality in the data before 2010, more recently the E, S and G scores have very much complemented one another—that is, an issuer with a high environmental score, for example, is no longer likely to also have high governance and social scores.
Incorporating active ESG-tilt strategies into portfolios
We aimed to build active ESG-tilted portfolios immunized to the influences of market sector, rating and duration—the three main systematic market factors that influence corporate credit instruments’ price and volatility. We wanted to ensure that any active outperformance was driven purely by our ESG-based ticker selection methodology. The results of our back-testing are presented in EXHIBIT 1 and EXHIBIT 2 in two forms: gross, assessing only the information content of the ESG drivers, and net, after typical transaction costs.
Conclusion: an ESG overlay likely results in alpha opportunities
This study asked whether the ESG scores developed by firms like MSCI enhance the process of investing in corporate bonds, whether this information is additive to credit agencies’ bond ratings and whether an ESG overlay in portfolio construction is likely to result in alpha opportunities. Our findings indicate a positive answer to all three questions.
We find that an ESG overlay can be used to enhance portfolio returns. The gross returns of all of our market sector, rating and duration-controlled ESG-tilt strategies are either comparable to, or higher than, those of their relevant ESG benchmarks. In the IG space, this result holds true net of transaction costs. However, in the HY and EM universes, after costs are applied the active ESG-tilt strategy net returns are lower than those of their respective ESG benchmarks. So real-world transaction costs do matter for returns.
We conclude that ESG scores can be utilized to enhance portfolio outcomes, via lower drawdowns, reduced portfolio volatility and, in some cases, marginally increased risk-adjusted returns. Further, our overall findings suggest that MSCI scores are additive to traditional credit ratings; the contingent liabilities related to E, S and G are not necessarily factored into conventional credit rating agency bond ratings.
1Several studies verify that companies rated poorly on sustainability have a higher cost of capital. For a detailed consideration, see the full paper.
2MSCI provides our fixed income investment management team with an ESG data feed covering 6,000 global companies (13,000 issuers including subsidiaries) mapping to more than 590,000 equity and fixed income securities; ESG scores range from 0 (worst) to 10 (best).
3For a longer paper that includes the study methodology and analytics, please contact your Client Advisor.
4This turnover-slowdown methodology is described in the full version of this paper.
5Up until 2012, only 30% of HY and EM bonds were ESG-rated. While our study’s IG bond back-testing starts in 2007, due to this constraint the HY and EM testing begins post-2012, when ESG coverage rose above 50%.
PI-ESG-BONDS-EXEC | 0903c02a82604350

