Maturing public pension plans: Strategies to overcome market volatility and portfolio illiquidity
How can maturing public pensions -- facing a cash drain, lower tolerance for volatility and a reduced capacity for portfolio illiqudiity -- handle these challenges?
2020-03-13
Michael Buchenholz
In Brief
- Maturing pension plans have a reduced ability to tolerate market volatility and portfolio illiquidity, yet to meet their expected return needs, most plans will need volatile and illiquid assets; several investment strategies may help overcome these challenges.
- As public pension plans age and their demographic composition shifts—employee contributions diminish as outflows for retiree benefits increase—plans experience a cash drain, with significant investment implications.
- This paper considers solutions, and shows that many public pension plans actually do have the capacity to add illiquidity to their portfolios, enabling them to potentially build out larger allocations to core alternatives.
- Core alternatives—assets with a large percentage of total returns coming from forecastable cash flows, including well-leased properties and regulated utilities—can potentially offer high income, low beta to traditional markets and relatively high returns.
- We also consider other solutions to aging public pension plans’ challenges, including long-duration bonds, cash flow matching and derivative overlays/leverage.
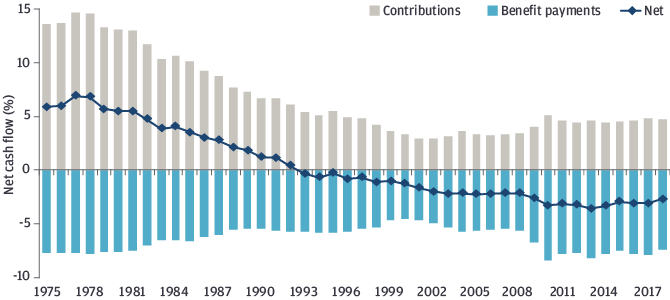
Aging comes with challenges, and for aging public pension systems—maturing due to demographic changes, improved mortality and structural shifts in the public sector— one of the biggest is a cash drain with significant effects. Since 1992, the average ratio of active participants to retirees and beneficiaries has fallen from 2.5x to 1.3x. As plan composition shifts away from active employees and more heavily toward retirees and beneficiaries, cash inflows diminish and benefit outflows increase, the net impacts of which are persistent and growing negative net cash flows (Exhibit 1) and a reduced capacity to recover from downturns through cash contributions.3
While we don't think plan sponsors need fear this demographic evolution, we do think it has significant implications for pension investment strategies. It 1) reduces plans' ability to absorb market volatility and 2) diminishes tolerance for portfolio illiquidity. How can maturing public pension sponsors grapple with these challenges? For most plans, de-risking and avoiding illiquid investments are not feasible answers. They will require the volatile equities and illiquid alternative investments to meet their expected return needs. Rather, as this paper will demonstrate by analyzing pension plans' current cash flow positions and incorporating income into our cash flow measurements, some plans may have more capacity than their peers for illiquidity and volatility. That enables them to potentially enhance returns by building out a larger allocation to illiquid alternatives. We will also discuss the subset of plans at relatively greater risk from illiquidity that could benefit from adding income-generating and volatility-reducing strategies.
From there, we examine solutions—particularly core alternatives—to address both portfolio volatility and illiquidity risk. We find a powerful solution in core alternatives, assets with a large percentage of total return coming from forecastable cash flows, including well-leased properties, regulated utilities and transport assets—which potentially offer high income, low beta to public equity and fixed income markets, and relatively high returns.
EXHIBIT 1: PUBLIC PENSION CONTRIBUTIONS (GOVERNMENT AND EMPLOYEE) DECLINED FROM USD 83 BILLION IN EXCESS OF BENEFITS PAID OUT (1974–84) TO A MASSIVE USD 940 BILLION SHORTFALL (2008–18)
State and local pension cash flow (as % of plan assets)
Source: U.S. Census Quarterly Survey of Public Pensions, J.P. Morgan Asset Management; data as of February 17, 2020.
The challenges plan sponsors face as a result of aging public pensions
What does all this mean for public pension plans? Maturing profiles and a cash drain present several challenges for plan sponsors: Diminished tolerance for market volatility: One way to conceptualize this is a shortened investment horizon. More mature plans (and those facing solvency concerns) have a shorter liability duration and will pay out a greater proportion of benefits over the near term. There is relatively less time to recover funded status through contributions and investment earnings following market losses.
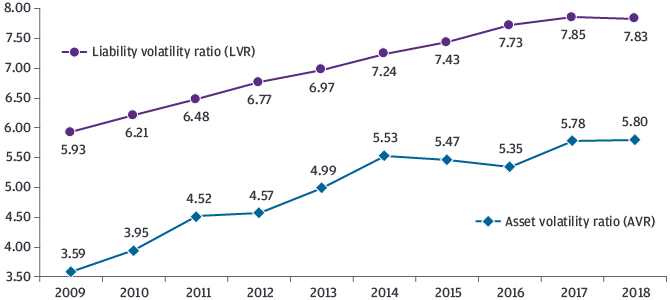
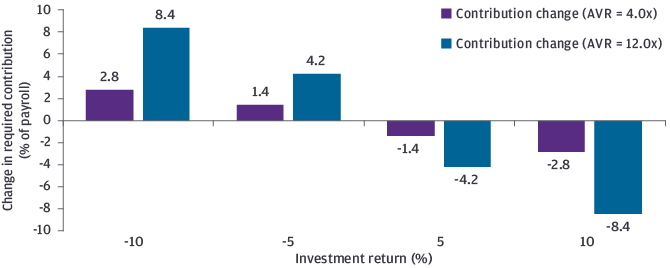
Another way to frame the situation is that any losses must be amortized across a smaller population of active participants. Thus, as plans age, investment volatility more readily translates into contribution volatility—and, to the extent that required contributions are not fully forthcoming, funded status volatility. This sensitivity is captured by the asset volatility ratio (AVR), the ratio of assets’ market value to covered payroll. For the top 100 public pensions by assets, the aggregate AVR (fiscal year 2018) was 5.8x (Exhibit 2). An AVR of 4.0x means that a 10% drop in the asset portfolio would be equivalent to 40% of covered payroll and translate roughly into a 2.8% increase in annual payroll contributions (Exhibit 3). A more mature plan with an AVR of 12.0x would require an 8.4% increase in payroll contributions given the same 10% portfolio loss. A similar metric also increases—the liability volatility ratio (LVR), the ratio of the actuarial accrued liability (AAL) to covered payroll—indicating sensitivity to unexpected changes in the liability.
EXHIBIT 2: RISING AVR AND LVR SIGNIFY PUBLIC PENSION PLANS’ INCREASING MATURITY AND RESULTING SENSITIVITY TO MARKET VOLATILITY
Top 100 plans’ average asset volatility ratio (AVR) and liability volatility ratio (LVR)
Source: Public Plans Database, J.P. Morgan Asset Management; data as of February 17, 2020. Top 100 plans aggregates the 100 largest public pension plans by asset value. AVR: ratio of assets’ market value to covered payroll; LVR: ratio of actuarial accrued liability (AAL) to covered payroll.
EXHIBIT 3: THE GENERALLY HIGHER AVRS OF MATURE PLANS MAKE THEIR REQUIRED CONTRIBUTIONS MORE SENSITIVE TO A DECLINE IN PENSION ASSET VALUE
Illustration of investment return impact on required contributions
Source: J.P. Morgan Asset Management; data as of February 17, 2020.
Calculations assume a 20-year amortization period, a discount rate of 7.0%, payroll growth of 3.0% and a level percent of pay amortization method. AVR: asset volatility ratio, ratio of assets’ market value to covered payroll.
Reduced capacity for portfolio illiquidity
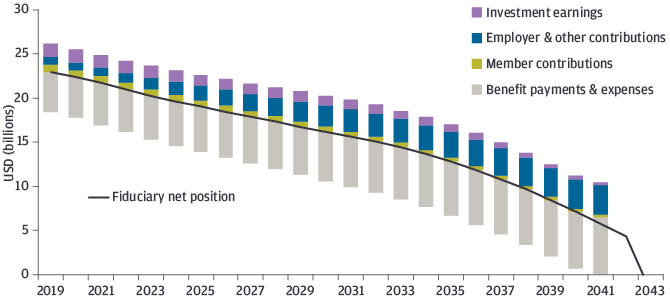
Plans persistently sending more money out the door than is coming in must make up the difference through asset sales, income or, more likely, some combination. Extreme cases of cash outflow, particularly for severely underfunded plans, may create a “death spiral” scenario. Exhibit 4 illustrates the asset and cash flow projections of a pension plan expected to deplete its assets within the next 30 years, due to a combination of underfunding and persistent net cash outflows. One way that liquidity risk constrains plans is by compromising their rebalancing capabilities—a plan becomes unable to maintain its desired asset allocation and can’t take advantage of market dislocations. Less commonly, the liquidity risk may be realized in the forced sale of illiquid assets at a haircut because liquid resources have been exhausted. As the cash flow draw on plan assets accelerates, both these expected costs increase in tandem and can be magnified in a market drawdown. For example, in a market pullback, private equity distributions will normally fade while capital calls will continue unabated, just as portfolio liquidity needs are greatest.
EXHIBIT 4: AN UNDERFUNDED PLAN EXPERIENCING PERSISTENT NEGATIVE CASH FLOWS WILL EVENTUALLY DEPLETE ITS ASSETS
Illustration of public pension plan depletion date
Source: Teachers’ Pension & Annuity Fund of New Jersey GASB 67 Report, J.P. Morgan Asset Management; data as of June 30, 2018.
How can public pension plans react? Many have capacity to add illiquidity
The simplest response to these volatility and liquidity risks would be to de-risk and avoid allocations to illiquid alternatives. However, for the vast majority of plans, these are not feasible options. The average investment return assumptions for public plans currently sits at 7.25% while the expectations for a liquid 60/40 stock-bond portfolio over the next 10 to 15 years, according to the 2020 Long-Term Capital Market Assumptions, is only 5.40%—a 185 basis point return gap. Most plans will need to maintain a sizable allocation to equities and contend with the volatility that such exposures carry, to meet return expectations. Plans are also increasingly trying to close the return gap with alternative assets, including real estate and private equity (Exhibit 5). Ours, and most of our peers’, capital market assumptions tell a similar story regarding the need for alternatives on a forward-looking basis to increase the chances of fulfilling return expectations.
EXHIBIT 5: ACROSS ALL PERFORMANCE QUARTILES IN THE SAMPLE PERIOD, REAL ESTATE AND PRIVATE EQUITY SIGNIFICANTLY OUTPERFORMED PUBLIC EQUITY AND FIXED INCOME IN PUBLIC PENSION PORTFOLIOS
Annualized returns for public pension plans by quartile (2001–16)

Source: Boston College Center for Retirement Research, J.P. Morgan Asset Management; data as of July, 2018.
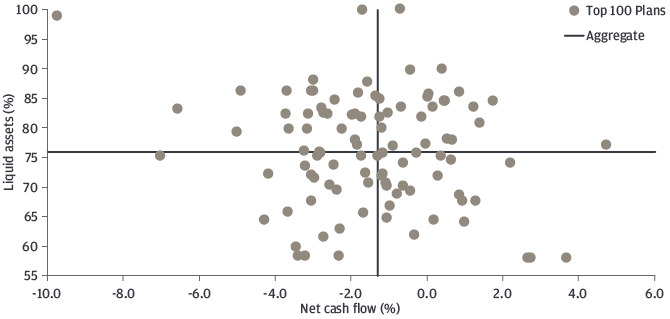
From here, we can demonstrate that certain plans could enhance returns by building out a larger allocation to illiquid alternatives. Analyzing public pension plans’ current cash flow positions—and, importantly, incorporating income into these cash flow measurements—shows that many plans do have the capacity to add illiquidity to their portfolios. Exhibit 6 plots the top 100 plans’ net cash flow vs. the proportion of their allocations to liquid assets. Here, net cash flows are employee and/or employer contributions and investment income, less benefit payments and expenses as a percentage of assets. Compared with their peers, plans plotting in the top right quadrant have a relative excess of liquid assets and positive to mildly negative net cash flows. These plans could enhance returns by building out a larger allocation to illiquid alternatives. On the other hand, plans in the lower left quadrant are at a relatively greater risk of liquidity issues and could benefit from adding income-generating, as well as volatility-reducing, investment strategies.
EXHIBIT 6: PLANS IN THE TOP RIGHT QUADRANT HAVE A RELATIVE EXCESS OF LIQUID ASSETS AND POSITIVE TO MILDLY NEGATIVE NET CASH FLOWS, SUGGESTING A LARGER ALLOCATION TO ILLIQUID ALTERNATIVES MAY BE APPROPRIATE TO ENHANCE RETURNS
Top 100 plans’ net cash flow vs. allocations to liquid assets (%)
Source: Public Plans Database, J.P. Morgan Asset Management; data as of December 31, 2018.
Net cash flow is employee and/or employer contributions and investment income, less benefit payments and expenses, as a percentage of assets.
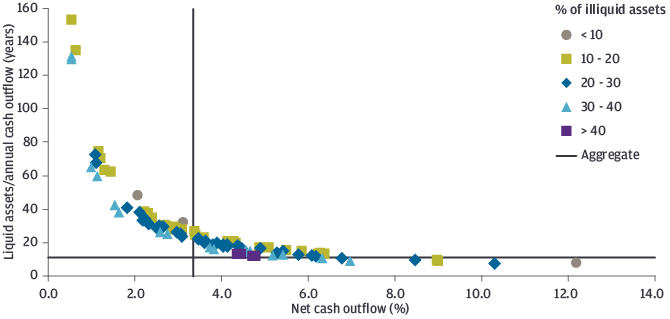
While Exhibit 6 looks at these plans’ net cash flow under current positioning, what would happen in a shock scenario? Next we examine the same plans under a hypothetical 50% reduction to the employer contribution. Five of the top 100 plans still manage to maintain positive cash flows under this scenario, but the positioning of the remaining 95 is shifted to varying degrees, depending on the extent of their reliance on employer contributions for their cash needs (Exhibit 7). We see that, all else equal, even under a stress scenario many plans would still have enough liquid assets to sustain the increased negative net cash flow for another 30 years.
EXHIBIT 7: EVEN WITH A MAJOR REDUCTION IN EMPLOYER CONTRIBUTIONS, MANY PLANS WOULD STILL HAVE SUFFICIENT LIQUIDITY, GIVEN CURRENT ALLOCATIONS, TO SUSTAIN MULTIPLE YEARS OF NEGATIVE NET CASH FLOW
Top 100 plans stress scenario: Net cash outflow vs. years liquid assets can cover net cash outflows
Source: Public Plans Database, J.P. Morgan Asset Management; data as of fiscal year 2018.
Stress scenario assumes a 50% cut to the fiscal year 2018 employer contribution.
What solutions can address aging pensions’ dual symptoms - portfolio volatility and illiquidity risk?
Against this backdrop, we consider what tools are available to public pension plans’ asset allocators to address these dual symptoms of pension maturation—volatility, illiquidity risk or both (Exhibit 8).
EXHIBIT 8: THERE IS A RANGE OF INVESTMENT TOOLS ACROSS ASSET CLASSES THAT CAN HELP MANAGE VOLATILITY AND ILLIQUIDITY
Summary, solutions for portfolio volatility and illiquidity risk
| Solution | Description | Example | Volatility reduction |
Illiquidity mitigation |
Considerations |
|---|---|---|---|---|---|
| Long-duration bonds |
Long-duration fixed income provides capital-efficient duration exposure to diversify equity risk | STRIPS, long U.S. government, credit |
x | Low expected returns are a concern but can be partially mitigated by active management. | |
| Cash flow matching | Matching near-term benefit payments with principle and coupon income from fixed income assets | Custom short-duration fixed income portfolio | x | Ties up capital in low-returning fixed income. | |
| Option strategies | Explicitly defined protection against market events | Put spread equity collar, Tail risk hedge funds | x | x | Can be costly to maintain (for volatility mitigation) and to increase tail risk (for income generation). |
| Uncorrelated hedge funds | Hedge fund strategies with novel equity diversification (low equity beta and low correlation) | Quant/ machine learning |
x | Often capacity-constrained, and fees are generally high. | |
| Core alternatives | Large portion of total return coming from cash income and accurately forecasted cash flows | Core global infrastructure equity, core global transportation leasing | x | x | Generally open-ended with quarterly liquidity, but may have initial soft-lock period and redemption queues. |
| Overlays/ leverage |
Achieving notional portfolio exposure of over 100% through use of derivatives | U.S. Treasury futures, E-mini S&P 500 futures | x | x | Involves operational complexity and collateral management costs. |
Source: J.P. Morgan Asset Management.
Let’s look at some of these solutions in more depth, starting with real assets’ role in public pension portfolios:
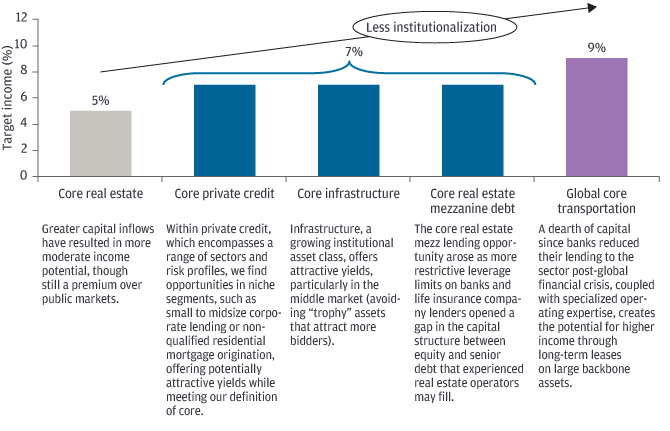
Core alternatives are a powerful solution set with the ability to address both volatility and liquidity risks. We refer to private alternative asset classes as “core” if a large percentage of their total return comes from cash income and their cash flows can be forecasted for long periods of time with a low margin of error. Core alternatives are also generally available in open-ended funds, providing quarterly liquidity in normal times. Core real assets include well-leased properties in major developed markets; regulated utilities and other infrastructure sectors with transparent, predictable cash flows in developed markets; and large backbone transportation assets (maritime vessels, aircraft, rail cars, etc.) that feature long-term contracts with high credit quality counterparties.
Three characteristics allow core alternatives to help alleviate multiple symptoms of public plan aging (Exhibit 9):
- High income: Income accounts for 60%-90% of the total return, which enhances the fund’s net cash flow position and helps offset the partial liquidity of the underlying strategy.
- Low beta: Low correlation to broader markets and, to a great extent, each other helps dampen portfolio volatility and provide resiliency in an equity drawdown.
- High returns: Target returns are comparable to or in excess of developed market public equity.
EXHIBIT 9: WITH THEIR POTENTIALLY HIGH INCOME, LOW BETA AND HIGH TARGET RETURNS, CORE ALTERNATIVES CAN HELP PUBLIC PENSION PLANS CLOSE THE INVESTMENT RETURN GAP
Target net returns and expected income for a range of core alternatives
Source: J.P. Morgan Asset Management—Global Alternatives; data as of August 31, 2019. For illustrative purposes only. The targets in the chart are simplified figures subject to market conditions and other specific factors. These should not be taken as representative of any J.P. Morgan fund targets. The target returns are for illustrative purposes only and are subject to significant limitations. An investor should not expect to achieve actual returns similar to the target returns shown above. Because of the inherent limitations of the target returns, potential investors should not rely on them when making a decision on whether or not to invest in the strategy. Please see the full Target Return disclosure at the conclusion of the presentation.
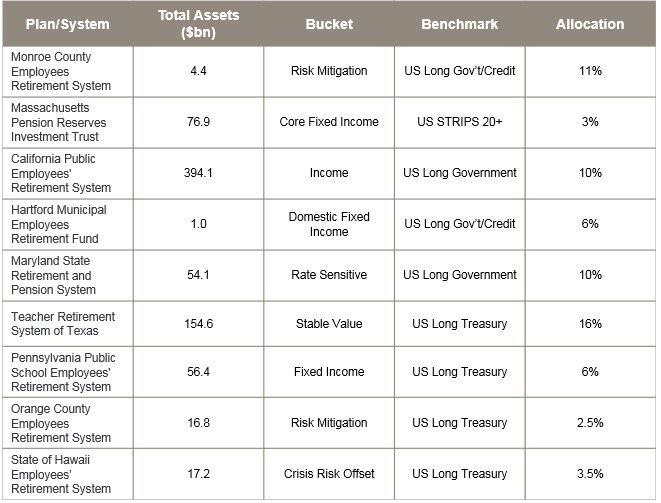
Long-duration fixed income is an increasingly popular volatility reduction strategy, more traditionally utilized in corporate pension plans (Exhibit 10). Equity downturns have historically coincided with “flight to quality” rallies in U.S. rates, especially at the long end of the Treasury curve. However, due to the low interest rate environment, long-duration fixed income strategies have a high opportunity cost in return give-up. Returns can be enhanced through active management and pushing out the risk curve into credit and other long-duration sectors, but that must be balanced against a desire for liquidity, to be able to opportunistically rebalance in a downturn. While this category of volatility reduction strategies may alleviate some of the dangers of a high AVR, they don’t directly address the negative net cash flow issue.
EXHIBIT 10: LONG-DURATION FIXED INCOME IS INCREASINGLY POPULAR AMONG CORPORATE PENSION PLANS FOR REDUCING VOLATILITY
Select plans with long-duration benchmarks
Source: J.P. Morgan Asset Management; individual plan CAFRs as of fiscal year 2018.
Cash flow matching: Alternatively, matching near-term benefit payments with short-duration fixed income can significantly boost a plan’s net cash flow position and correspondingly increase its budget for illiquidity. For example, if benefit payments for the next several years are secured with a high degree of certainty, the probability of needing to sell an illiquid asset for liquidity purposes is greatly reduced. But this does little to dampen overall portfolio volatility.
Derivative overlays/leverage: The use of derivatives to achieve notional exposures above the total physical portfolio value is a tool that can cultivate both volatility reduction and liquidity support. One instance comes from CalPERS, whose investment committee recently approved a change to the investment policy allowing up to 20% leverage. CIO Ben Meng has explained that “one of the undesirable outcomes during a drawdown is that we don’t have money to deploy to take advantage of a market dislocation. And one of the ways we generate additional liquidity is to put leverage on the total fund.” In addition to being an explicit source of liquidity, leverage can allow a plan to replace “easy-to-replicate” strategies like Passive U.S. Large Cap and U.S. Treasuries with derivatives while reallocating that, previously tied-up, capital to income-generating strategies targeted toward improving net cash flows. For example, a short-duration cash flow matching strategy combined with interest rate overlays can provide both the volatility reduction characteristics of long-duration bonds and the illiquidity mitigation characteristics of a high income strategy.
Conclusion
For thousands of years, various cultures have told stories about a “fountain of youth.” Although modern claims for life-extension products abound, we know no cure for human aging—or that of pensions. But pensions have powerful tools to manage the symptoms. As aging of pension plans of all types continues, these investment tools will become more important as levers for increasingly constrained portfolios. Each plan sponsor will have its own unique objectives and constraints, so there is no one-size-fits-all solution, but most can age more gracefully—by anticipating and planning for lower volatility tolerance and net cash outflows.
1 There’s even a clinical term—gerascophobia—an abnormal and persistent fear of growing old.
2 Source: United States Census – Quarterly Survey of Public Pensions.
3 In recognition of the magnitude and impact of this aging trend, the Society of Actuaries recently adopted standards of practice that apply to measuring pension risk (Actuarial Standard of Practice No. 51, – effective November 1, 2018), including multiple measures of plan maturity.
4 Contribution calculations assume a 20-year amortization period, a discount rate of 7.0%, payroll growth of 3.0% and a level percent of pay amortization method.
5 “NASRA Issue Brief: Public Plan Investment Return Assumptions,” NASRA, February 2019..
6 “California Public Employees’ Retirement System Total Fund Investment Policy,” CalPERS, September 16, 2019. https://www.calpers.ca.gov/docs/total-fund-investment-policy.pdf.
7 “Meeting – State of California Public Employees’ Retirement System Board of Administration Investment Committee Open Session” transcript, CalPERS, June 17, 2019. https://www.calpers.ca.gov/docs/board-agendas/201906/invest/transcript-ica.pdf, pp. 112.
09zf231309175410