Liability Aware Investing for Public Pension Plans
Formulating the role of liabilities in asset allocation and performance measurement
2021-10-27

Michael Buchenholz, CFA, FSA
Head of U.S. Pension Strategy,Institutional Strategy and Analytics

Jason Malinowski
Chief Investment Officer,Seattle City Employees’ Retirement System
Summary
- Public pension plans tend to focus disproportionately on investment performance whilepaying only cursory attention to liability performance. We believe public pensionliabilities can, and deserve to, play a more central role in portfolio construction andholistic performance measurement.
- Assets and liabilities are inextricably linked through the expected return on assets(EROA) discounting mechanism. Realized investment returns drive plan assets, but alsoplan liabilities as a consequence of their impact on asset valuations and thus forward-looking expected returns.
- This paper introduces Liability Aware Investing (LAI) as a broad portfolio constructionand risk management framework that explicitly incorporates this linkage between planassets and liabilities and funded status volatility as a holistic measurement of totalplan risk that quantifies the expected tracking error between assets and liabilities.
- LAI is NOT corporate pension liability-driven investing (LDI) applied to public plans.Rather, LDI can be conceptually understood as a narrow application of the broaderLAI framework.
- Asset class risk characteristics are altered when shifting from a traditional asset-onlyframework to an LAI framework. For example, some like public equity become moreattractive while others like cash become less attractive. LAI leads to moderate assetallocation changes relative to traditional asset-only mean-variance optimizationtechniques. In this sense, it can augment, rather than replace, current industry practices.
- LAI may justify taking on higher levels of asset volatility than a plan would otherwiseaccept before considering liability impacts, and thus support higher allocations toreturn-seeking assets. For example, the funded status volatility of public equity islower than its asset volatility.
- LAI can be a helpful additional tool for communicating total plan risk and performanceto investment committees and other plan stakeholders.
- This piece presents the groundwork and initial conceptual framework for LAI includingbroad principles and risk analytics. In practice, we expect adoption and implementationmethods across the public plan universe will vary based on unique plan characteristics,governance and beliefs as well as over time.
Introduction
Pension liability and keeping your eye on the ball
On May 26, 1959, Harvey Haddix pitched 12 perfect innings for the Pittsburgh Pirates against the defending National League Champion Milwaukee Braves, retiring the first 36 batters on 115 pitches—82 of them for strikes. While many consider the game to be the best pitching performance in Major League Baseball history, the Pirates actually ended up losing to the Braves 1-0. In a similar respect, public pension funds that focus solely on investment performance are only watching one-half of each inning. To truly gauge a winning performance, one must look up and occasionally check the scoreboard to see how the liabilities are performing. Admittedly, this hasn’t exactly been easy. Asset performance can be measured and refreshed in real time, while liability valuations are often perpetually stale, updated at most on an annual basis, and often conspicuously absent from asset/liability modeling (ALM) studies. However, we believe that liabilities can, and deserve to, play a more central role in the strategic asset allocation and holistic performance measurement process.
Over the years, and as corporate pension plans have broadly reached a consensus on liability-driven investing (LDI), many academics and practitioners have explored how LDI could be transposed into the public pension world, without a wholesale importation of the current framework, which discounts liabilities on corporate bond yields and leads to solutions heavily concentrated in high-quality public long duration fixed income. We believe these proposed methods (for example, cash flow matching) certainly have their merits, but may not be widely applicable or useful to all plans (for example, a plan open to new participants) or rather may serve as a constituent of a broader liability-focused framework.
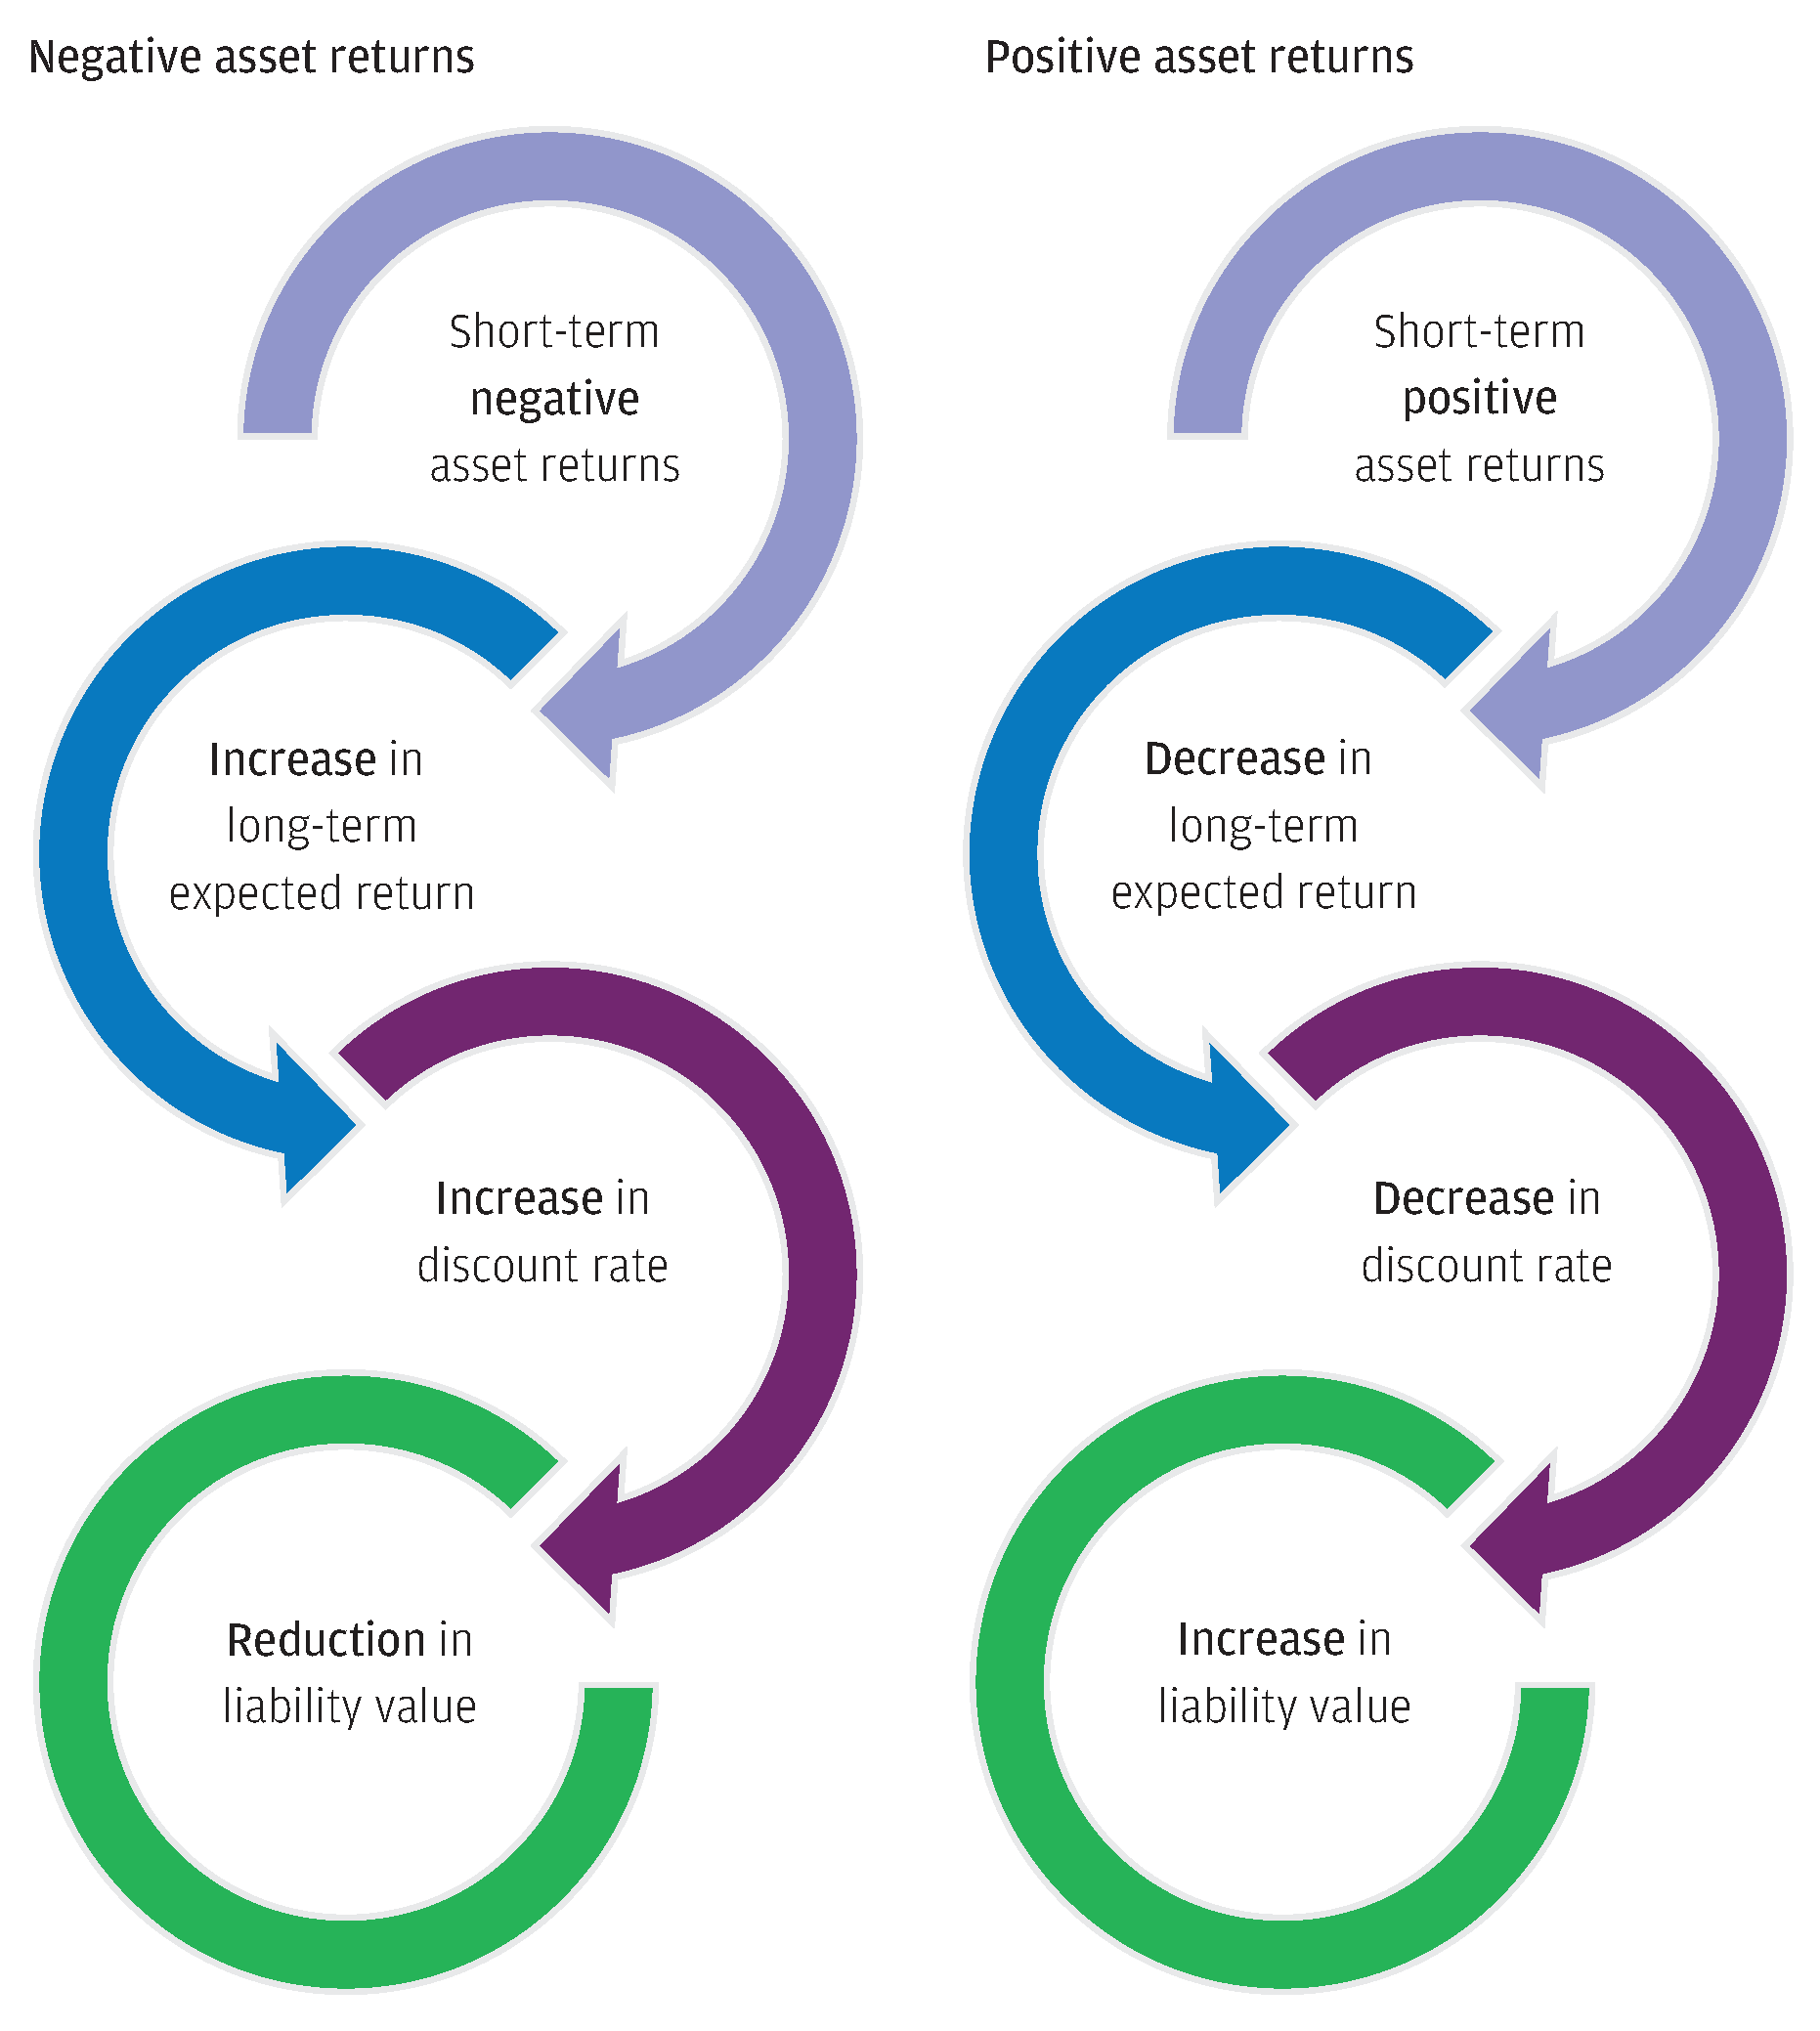
Liabilities are inextricably linked to the asset portfolio through the discounting mechanism used to present value future benefit payments, the expected return on assets assumption (EROA), which itself is informed by actual market returns. In fact, traditional corporate pension LDI can be understood as a narrowly defined application of this framework where the asset portfolio is limited to a (hypothetical) liability-immunizing portfolio of high-quality fixed income, rather than the (actual) total portfolio itself. We propose that portfolio construction and risk management explicitly incorporate this dynamic by modeling how the EROA assumption, and in turn liability valuation and volatility, will respond to realized market returns. Short-term negative asset returns will generally result in an increase in long-term expected returns, increasing the liability discount rate and reducing the value of the pension liability. The inverse chain of events occurs, as illustrated in Exhibit 1, in reaction to short-term positive asset returns. This positive correlation between asset returns and liability returns can be harnessed to proactively manage the volatility of plan funded status. Again, if you take the preceding description and replace the broader phrase “asset returns” with the more targeted phrase “high-quality fixed income returns,” you have in effect described corporate pension LDI.
Harnessing the positive correlation between asset and liability returns
Exhibit 1: Pension schematic: Relationship between asset returns and liability values
Source: J.P. Morgan Asset Management. For illustrative purposes only.
As it roughly stands now, a plan assuming a 7.0% expected return will construct a portfolio that meets the target, including alpha, while attempting to minimize portfolio volatility or some other measure of asset drawdown risk. But what if we considered how funded status might evolve by measuring this association between assets and liabilities? It doesn’t change the need for a 7.0% return, or the near-term employer contribution rates, but we find it leads to reasonably different portfolio solutions and may facilitate improved long-term economic decision making and pension health. In the remainder of the paper we will refer to this concept of asset/liability linkage as Liability Aware Investing (LAI) and the holistic measurement of total plan risk as funded status volatility, which quantifies the expected tracking error between plan assets and liabilities.
- Liability-aware investing (LAI): A broad framework that explicitly recognizes the linkage between plan asset and liabilities
- Funded status volatility: A holistic measurement of total plan risk that quantifies the expected tracking error between assets and liabilities
In order to be constructive and additive to current practice, we believe public pension LAI should prudently balance practical implementation with theoretically sound underpinnings. To that end, the utilization of funded status volatility for portfolio construction and risk measurement:
- Is entirely consistent with existing regulations and GASB accounting standards
- Leads to moderate asset allocation differences relative to traditional asset-only mean-variance optimization techniques. In this sense, the framework may be the primary driver of allocation decisions or, alternatively, used as a tiebreaker to choose between multiple portfolio options under consideration. Either way, we are not radically altering the makeup of a typical pension portfolio but instead making changes around the edges1
- May justify taking on higher levels of asset volatility than a plan would otherwise accept before considering the liability impacts, and thus support higher allocations to return-seeking assets
- Can be helpful in communicating asset/liability risk to investment committees and other plan stakeholders, even if adopted alongside more traditional risk and performance measurement analytics
LAI for Public Pension Plans
What makes the LAI framework so different from existing frameworks?
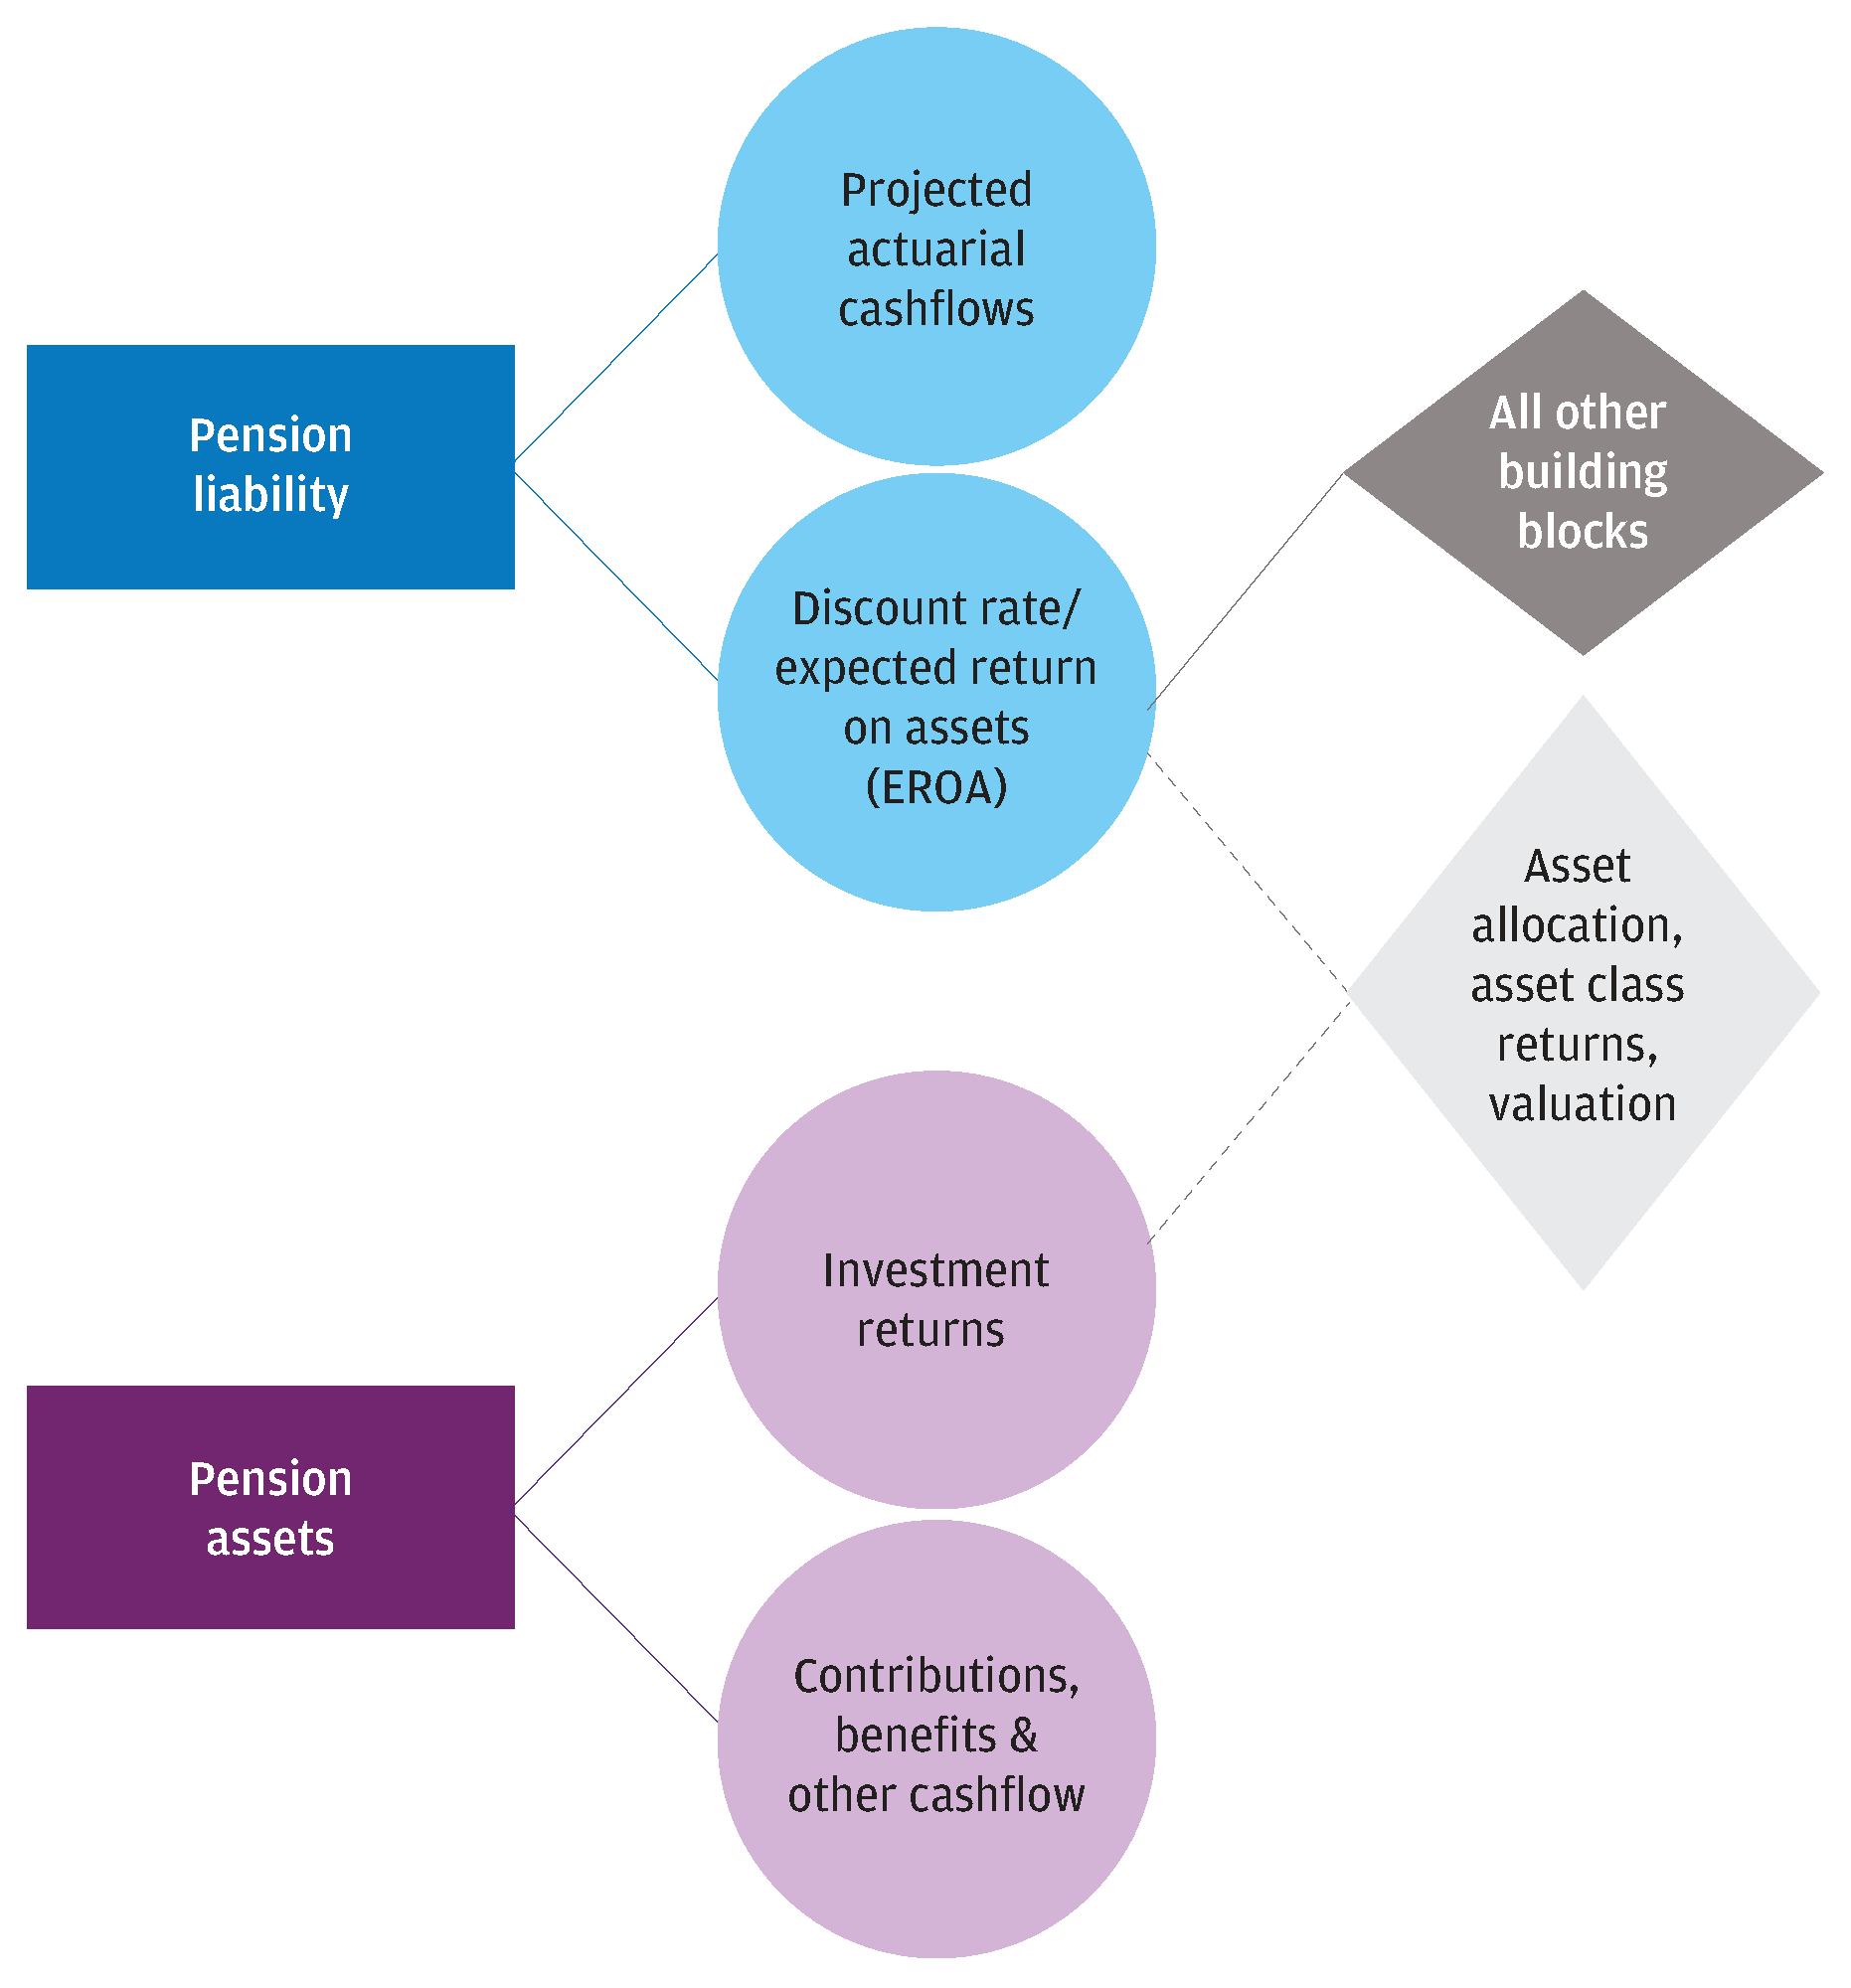
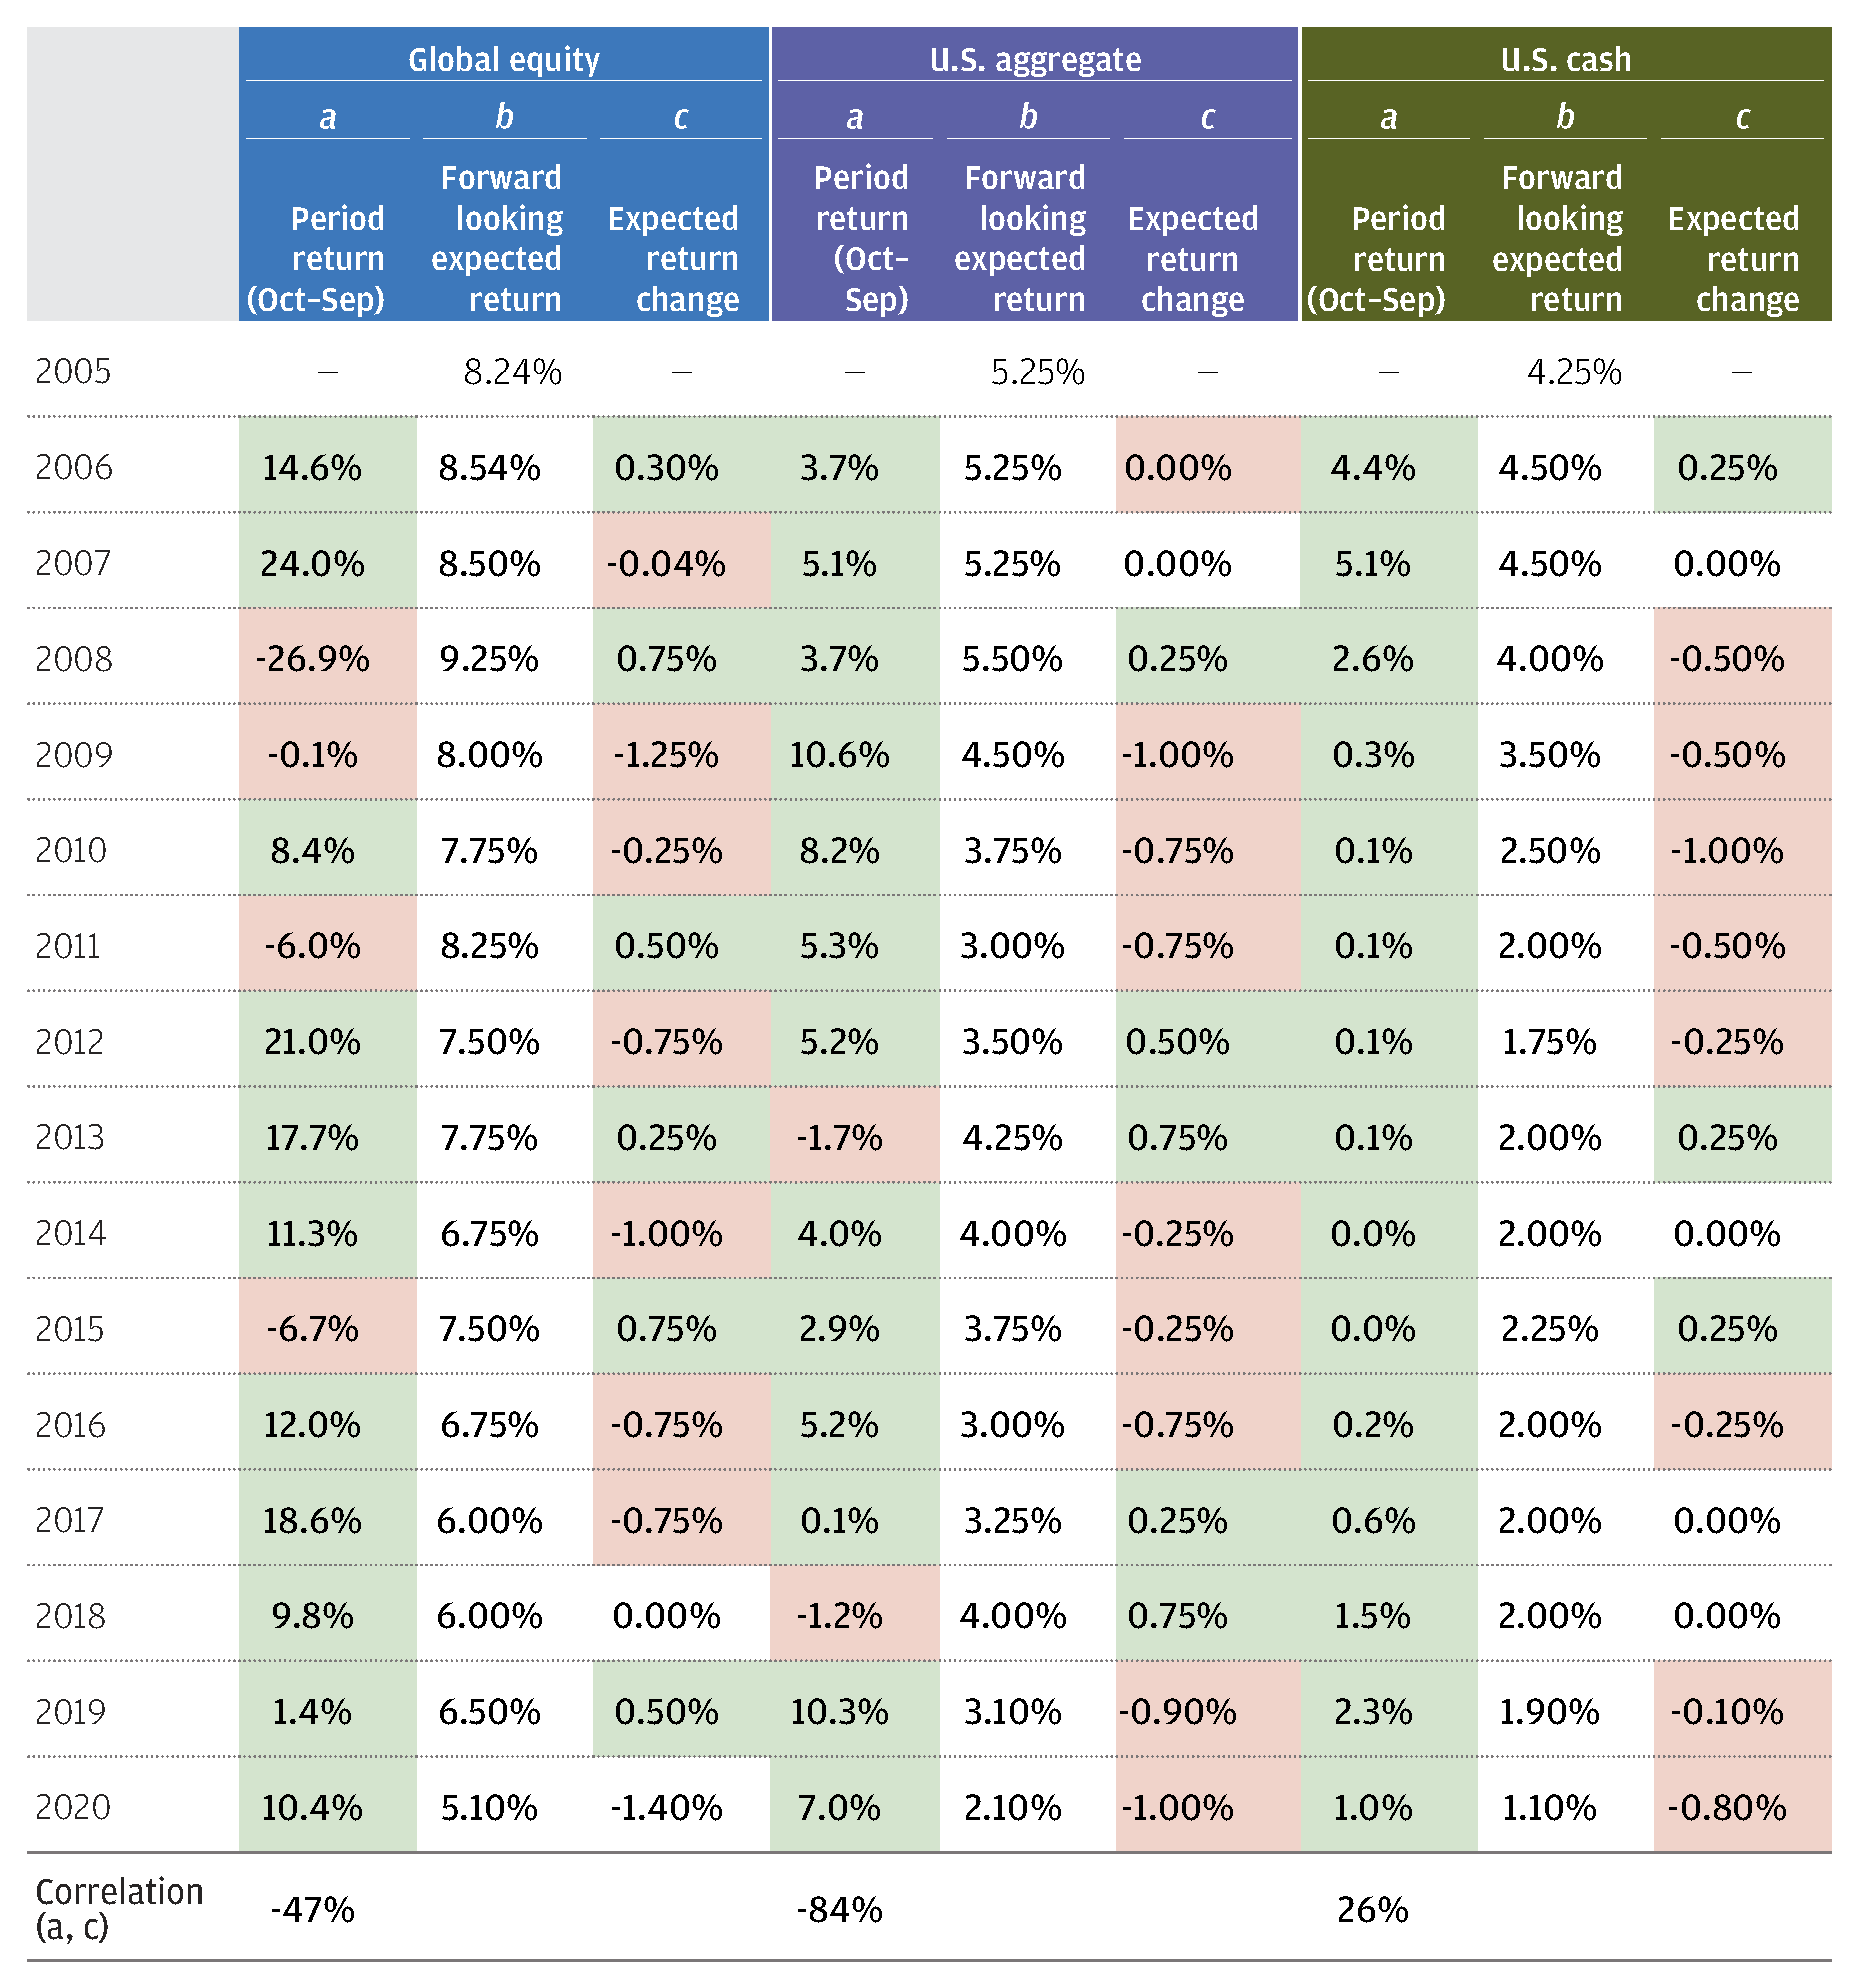
In its application, it’s not radically different, which makes it all the more accessible. The main differentiator is the explicit measurement of funded status volatility, accounting for the liability by modeling its volatility and correlation to other exposures vis-à-vis the asset allocation. The liability is market-based in the sense that asset allocation and market performance drive forward-looking expected returns, which are then used to calculate the expected return assumptions and liability discount rate (Exhibit 2). To be more precise, we are focused on the relationship between an asset class’s realized returns and the subsequent change in expected return assumption. For example, during the one-year period ending September 30, 20202, global equity returned +10.4% and JPMorgan’s 2021 LTCMA dropped the asset class assumption by 140bps, from 6.50% to 5.10% (Exhibit 3). The valuation impact reduced the assumption by around 225bps, but was offset by changes in other return building blocks, mainly an expectation of margins improvement. While asset class return expectations are driven by both cyclical and structural factors, the vast majority of year-over-year changes are a consequence of valuation adjustments. This insight is a foundational principle of the LAI framework.
Asset allocation and asset class returns impact both assets and liabilities
Exhibit 2: Pension schematic: Drivers of pension assets and liabilities
Source: J.P. Morgan Asset Management. For illustrative purposes only.
Relationship between realized returns and return expectation changes
Exhibit 3: JPMorgan’s long-term capital market assumptions
Source: J.P. Morgan Asset Management. For illustrative purposes only.
A simple example: Assumption stability ≠ funding stability
In order to demonstrate the concept of funded status volatility for public pensions, we provide a simplified, albeit unrealistic, example (Exhibit 4). A fully funded plan experiences a 12% drawdown in the portfolio, reflected in the reduced asset value. This market pullback also improves the valuation component of the portfolio’s forward-looking expected return—the assets it holds are now more attractive than just prior to the drawdown.3 Assuming a nominal liability (we will use nominal liabilities, in contrast to real, in the remaining body of the paper but address inflation linkage in the appendix; see call out box) with a PV1 of 12 (present value of 1% change in EROA; see call out box) and a 1.0% increase in the expected return, the liability value declines by an equivalent amount and full funding is maintained. In theory, if this relationship were to hold across the set of all possible asset returns, we could say that this plan is immunized from an LAI perspective.
While capital market assumptions from asset managers and consultants tend to fluctuate at least annually, most public plan systems keep their assumptions relatively constant, a sort of lagged declining step function, in the name of “stability.”
Immunization occurs when asset changes are completely offset by liability changes
Exhibit 4: Stylized example of public plan LAI

Source: J.P. Morgan Asset Management. Calculations assume a nominal Liability PV1 of 12. For illustrative purposes only.
Liability PV1: What’s in a name?
We generally recognize the term “duration” as measuring the sensitivity of a bond’s price to changes in yields. Similarly, we think of the “delta” of an option as the price sensitivity to changes in the underlying stock price. In order to appropriately describe the liability sensitivity, we deliberately chose to use the broader, more inclusive term, PV1 – short for present value of a 1% change in expected return assumption. This is because the liability is sensitive to changes in all asset class expected returns across the spectrum, whether impacted by yields, equity prices or other valuation factors.
This example shows that stability in the discount rate might in fact drive instability in the funding level and, in turn, volatility in the actuarially determined employer contribution (ADEC) rate. In some cases, more frequent and market-driven liability discounts facilitate reduced funded status volatility. For the plans that use a five-year or longer smoothing period for their actuarial value of assets (AVA), this more “mark-to-market” approach to assets and liabilities may display higher funded status volatility. However, this pattern would be expected to reverse for lower risk portfolios and for GASB disclosures where the plan assets (fiduciary net position) are based on market value.
Another way to understand LAI mechanics is as a countercyclical funding dampening effect. The expected return is reduced, a costly action in isolation, after favorable returns in the asset portfolio. In contrast, after large asset drawdowns, a corresponding increase to expected returns provides cost relief to plan sponsors who otherwise might need to dramatically boost contribution rates. As we will discuss later, a plan need not necessarily adopt a dynamic expected return assumption for this framework to be worthwhile as there are economic benefits from holding a higher expected return portfolio.
A simple example: Stocks, bonds & cash
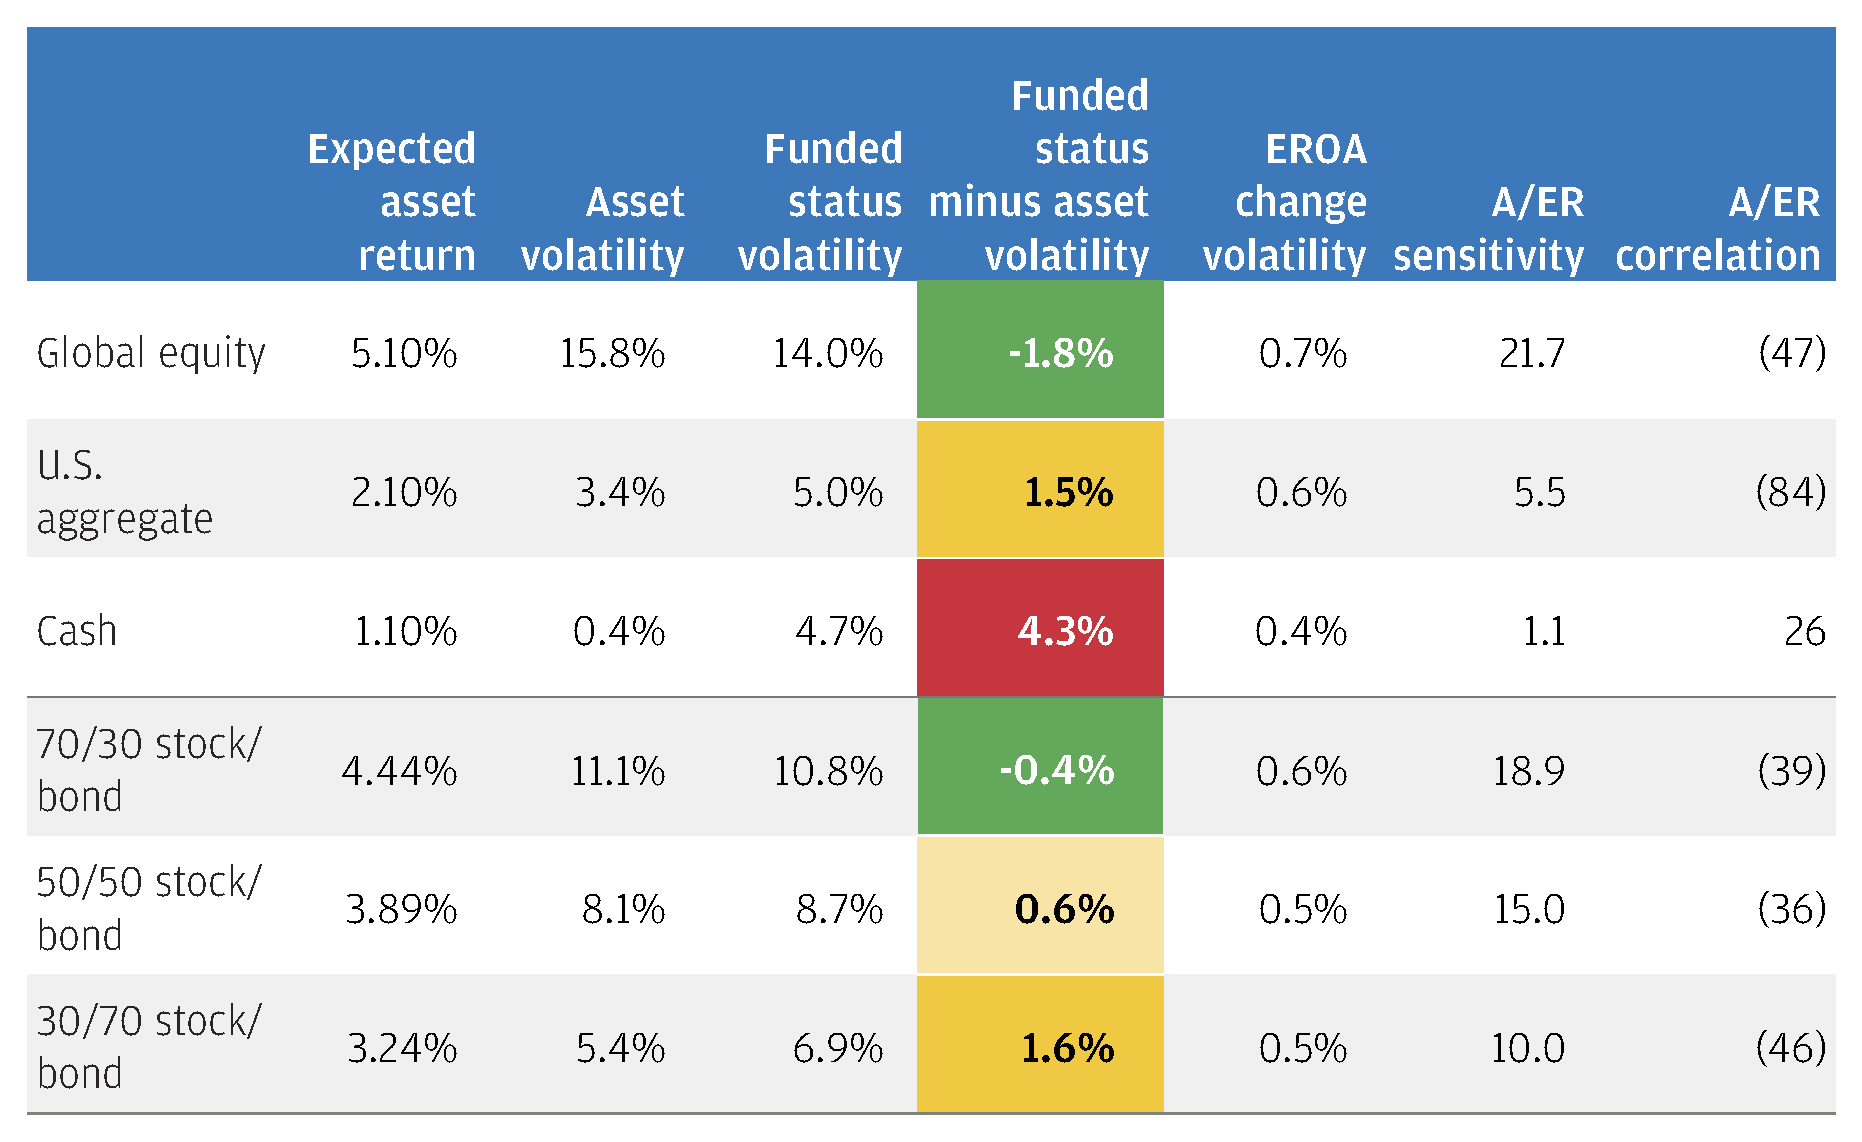
In order to explore these characteristics, we start with a small subset of core asset classes—global equity, U.S. aggregate bonds and cash— and draw out insights about their role in an LAI framework. Exhibit 3 outlined the historical realized returns and subsequent changes to the expected return assumptions. Exhibit 5 summarizes both the asset and resulting LAI metrics for these asset classes as well as some basic portfolios.
Public equity funded status volatility is lower than asset volatility
Exhibit 5: Asset class characteristics (Nominal liability PV1 of 12)
Source: J.P. Morgan Asset Management. For illustrative purposes only.
In the discussion below we introduce several novel LAI metrics that drive funded status volatility. A brief description is provided although we strongly recommend that readers explore the Appendix section titled “Is there specific analytical support for the LAI funded status volatility drivers” for a more in-depth explanation.
LAI Framework Metrics
- A/ER Correlation measures the correlation between the realized return and subsequent change in expected return. The closer this metric is to -100 (perfect negative correlation), the lower funded status volatility, all else equal.
- A/ER Sensitivity measures the ratio of the volatility of assets to the volatility of expected return changes. For most portfolios, higher metrics lead to lower funded status volatility, all else equal. For a perfectly immunized portfolio, the A/ER Sensitivity must equal the liability PV1.
- Asset volatility is also a driver of funded status volatility. All else equal (e.g., A/ER Correlation and Sensitivity are unchanged), higher asset volatility leads to higher funded status volatility.
From these metrics we can make some inferences regarding the application of an LAI framework in comparison to a traditional asset-only framework:
a) Cash isn’t risk-free: The funded status volatility of cash is more than 10x the asset volatility. Cash has a low A/ER Sensitivity and positive A/ER Correlation, both of which increase risk within the LAI framework. Poor realized cash returns are unlikely to be counterbalanced by increasing return expectations. They will generally beget further poor returns, and vice versa.
b) Equities aren’t as risky: The funded status volatility of public equity is lower than the asset volatility. A/ER Sensitivity (21.7) and Correlation (-47) indicate that expected return changes will tend to counterbalance realized returns and do so to an extent that is meaningful.
c) Traditional de-risking has limited efficacy: In a simple, two-asset portfolio, substituting core bonds for public equity reduces funded status volatility but at a much diminished rate relative to asset volatility. For example, going from 70/30 to 30/70 stock/bond reduces asset volatility by 600bps but reduces funded status volatility only by 400bps. The substitutions are improving A/ER Correlation but significantly reducing the A/ER Sensitivity measures.
Nominal vs. real pension liabilities
Many public plans have some form of cost-of-living adjustment (COLA) to protect the purchasing power of retirees’ benefits. COLAs can be automatic or applied on an ad-hoc basis, a fixed percentage or tied to an inflation index and furthermore may be linked to asset performance or funded status. The multiple dimensions of COLA application make it difficult to generalize inflation-linked liability analysis. For this reason, the main body of the paper focuses solely on nominal liabilities with a PV1 of 12, while we explore fully inflation-indexed liabilities (and varying the PV1 level) in the appendix. Many plan sponsors will find themselves falling somewhere in between these two poles.
Expanding the opportunity set
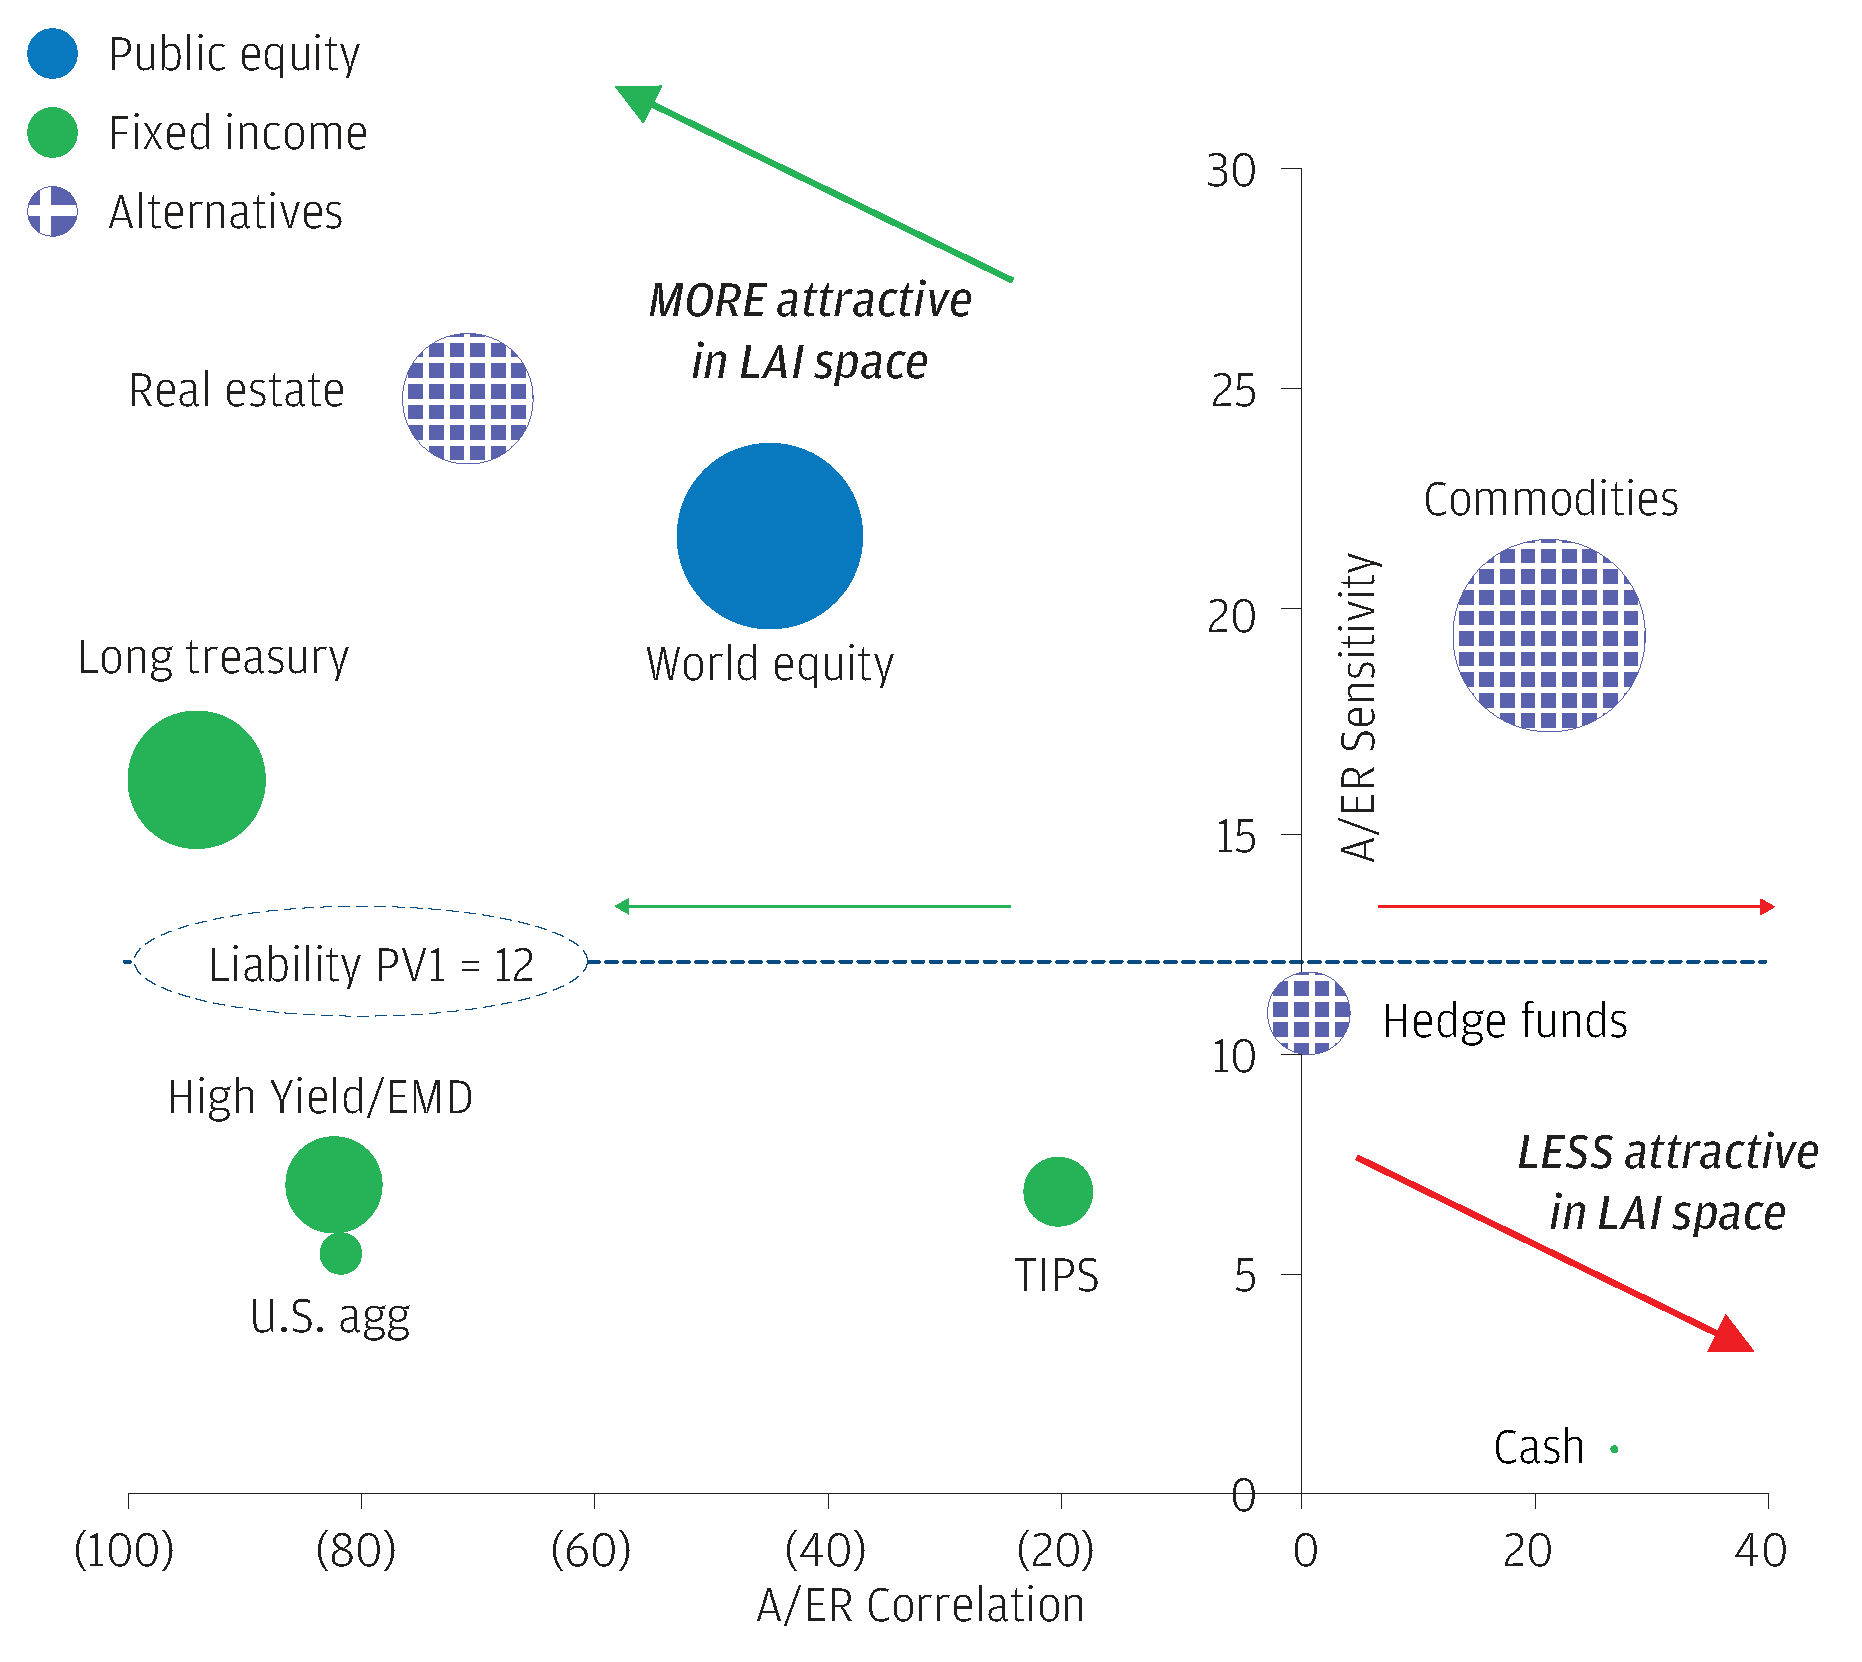
Moving past our simple example of LAI, we now open the door to a broader set of asset classes, gauging their risk through both the traditional asset-only lens and the proposed LAI funded status volatility lens. Exhibit 6 plots the governing properties of funded status volatility: A/ER Sensitivity, Correlation and asset volatility (bubble size). Based on these characteristics, we would expect assets plotting in the upper left, where return assumption changes are more responsive to realized market returns (high A/ER Sensitivity) and their relationship is more negatively correlated (low A/ER Correlation), to be more attractive in LAI space than asset-only space. Similarly, assets plotting in the lower right quadrant are expected to be less attractive. Positive A/ER Correlation leads to high funded status volatility, particularly at high levels of asset volatility. Thus, we would expect assets in the top right to be relatively less attractive as well.
LAI characteristics explain changes in asset class risk profile
Exhibit 6: LAI asset class characteristics: A/ER sensitivity, correlation and asset volatility (bubble size)
Source: J.P. Morgan Asset Management. For illustrative purposes only.
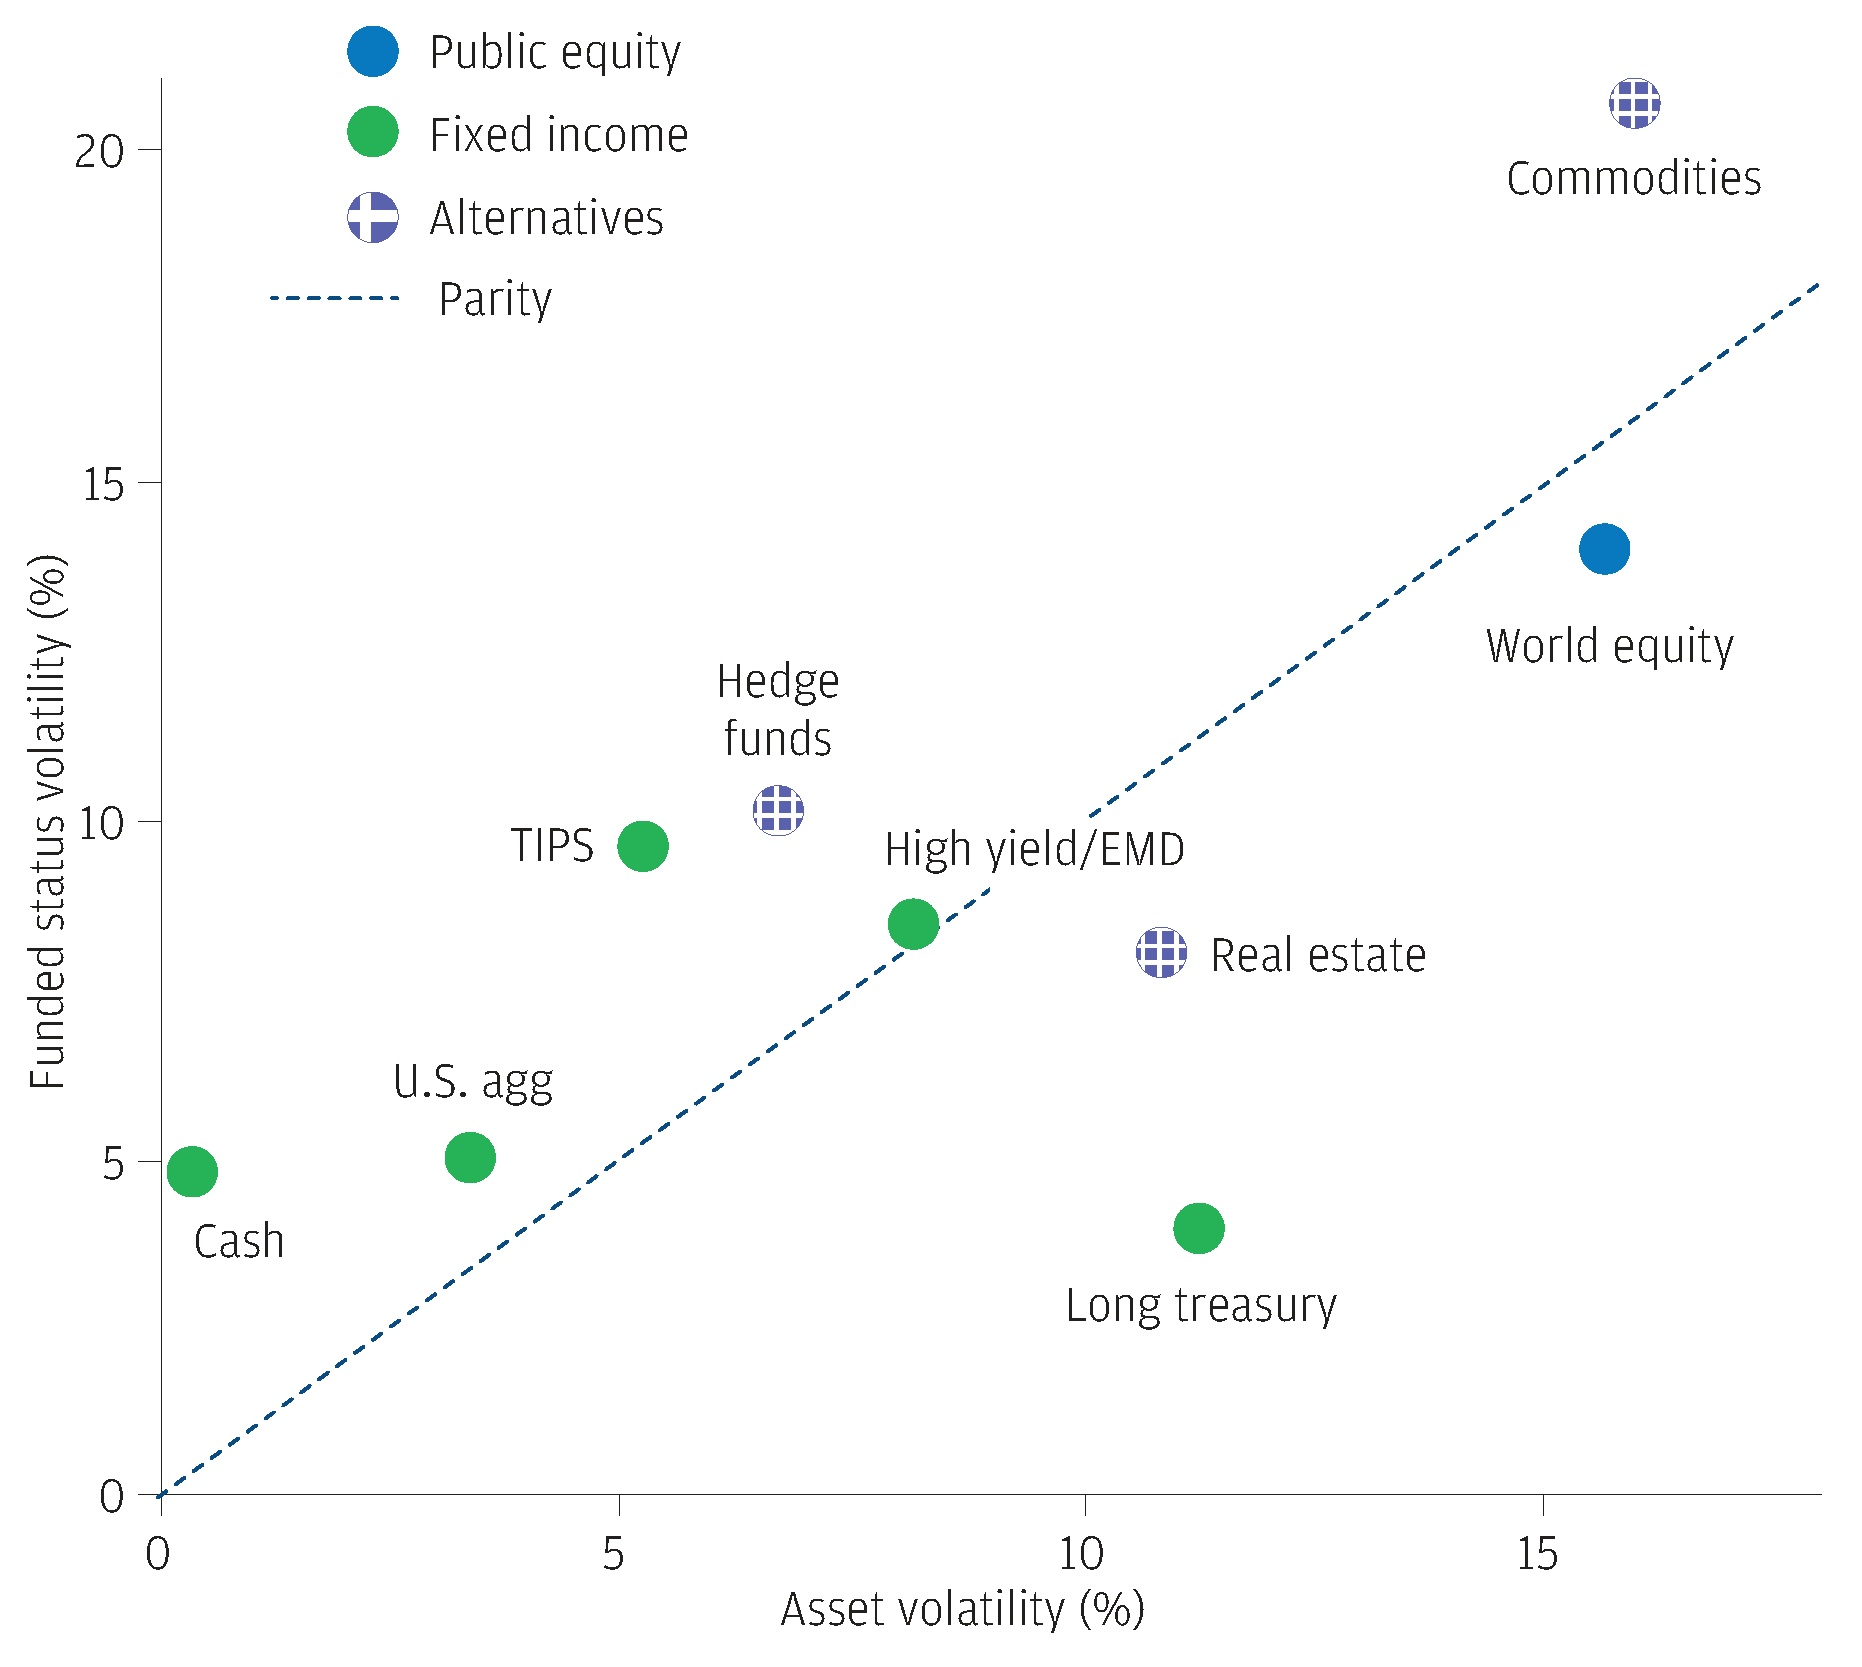
Exhibit 7 plots the asset volatility versus funded status volatility of each asset class and confirms these findings. Most asset classes plot fairly close to the parity line, again showing that higher levels of asset volatility are associated with higher levels of funded status volatility. Interestingly, we can see that long duration bonds exhibit low funded status volatility, reminiscent of the corporate pension LDI framework. This is partly because expected returns are closely related to the starting yield level. Thus yield changes will drive both actual returns and expected return changes in a predictable and proportional manner. The opposite is true for asset classes like cash and hedge funds, which in some sense can be thought of as cash-plus strategies and falter for the same reasons.
Exhibit 7: Changing the lens: Asset volatility vs. funded status volatility
Source: J.P. Morgan Asset Management. For illustrative purposes only.
Bringing expected returns into the equation, Exhibit 8 calculates efficiency ratios and return per unit of risk for each asset in both the asset-only and LAI space, and many of the same takeaways emerge. Cash (not pictured), core bonds and hedge funds are significantly less efficient in the LAI space, while long treasury and core real estate show marked improvements under the transformation in perspective.
Core bonds and hedge funds are less efficient in LAI space, while long treasury and core real estate show marked improvements
Exhibit 8: asset class efficiency in asset-only versus LAI framework

Source: J.P. Morgan Asset Management. For illustrative purposes only.
Crucially, we have only considered stand-alone asset characteristics, and none of this is to say that those asset classes that look less promising in the LAI space or have unfavorable A/ER Correlation and Sensitivities should be ignored. Returns are still paramount, and at this stage we are simply reformulating how to think about risk. Long duration bonds may be attractive from a risk perspective, but their paltry return expectations will quickly limit their size in a portfolio that aims to earn 7.0% or higher in the current environment. In the following section, we look at the implications of the LAI framework for portfolio construction where both risk and return are considered simultaneously and contemplate practical takeaways.
Private equity in LAI framework
Private equity certainly has high A/ER Sensitivity, like public equity, but depending on capital market assumption methodology, may have positive or negative observed A/ER Correlation. The latter may be the case where assumptions are anchored on public market equity returns but realized returns reflect lagged private valuations. While smoothing of private equity returns is helpful from an asset volatility perspective, it is disadvantageous from a funded status volatility perspective. For example, a rally in public equity markets can result in lower forward-looking returns (where public equity serves as the foundation for private equity capital market assumptions) and higher liability values, but may work its way through private equity valuations, and thus the portfolio, much more slowly. This tension between economic and smoothed valuations is familiar for pension funds and their actuaries. However, it is more an accounting or logistical issue than an economic one and certainly does not diminish the need for private equity in public pension portfolios. It could be addressed by, for example, applying exposure-weighted public equity returns as a mark-to-market proxy for private equity returns in an LAI measurement framework.
From theory to practice: LAI implications for portfolio construction
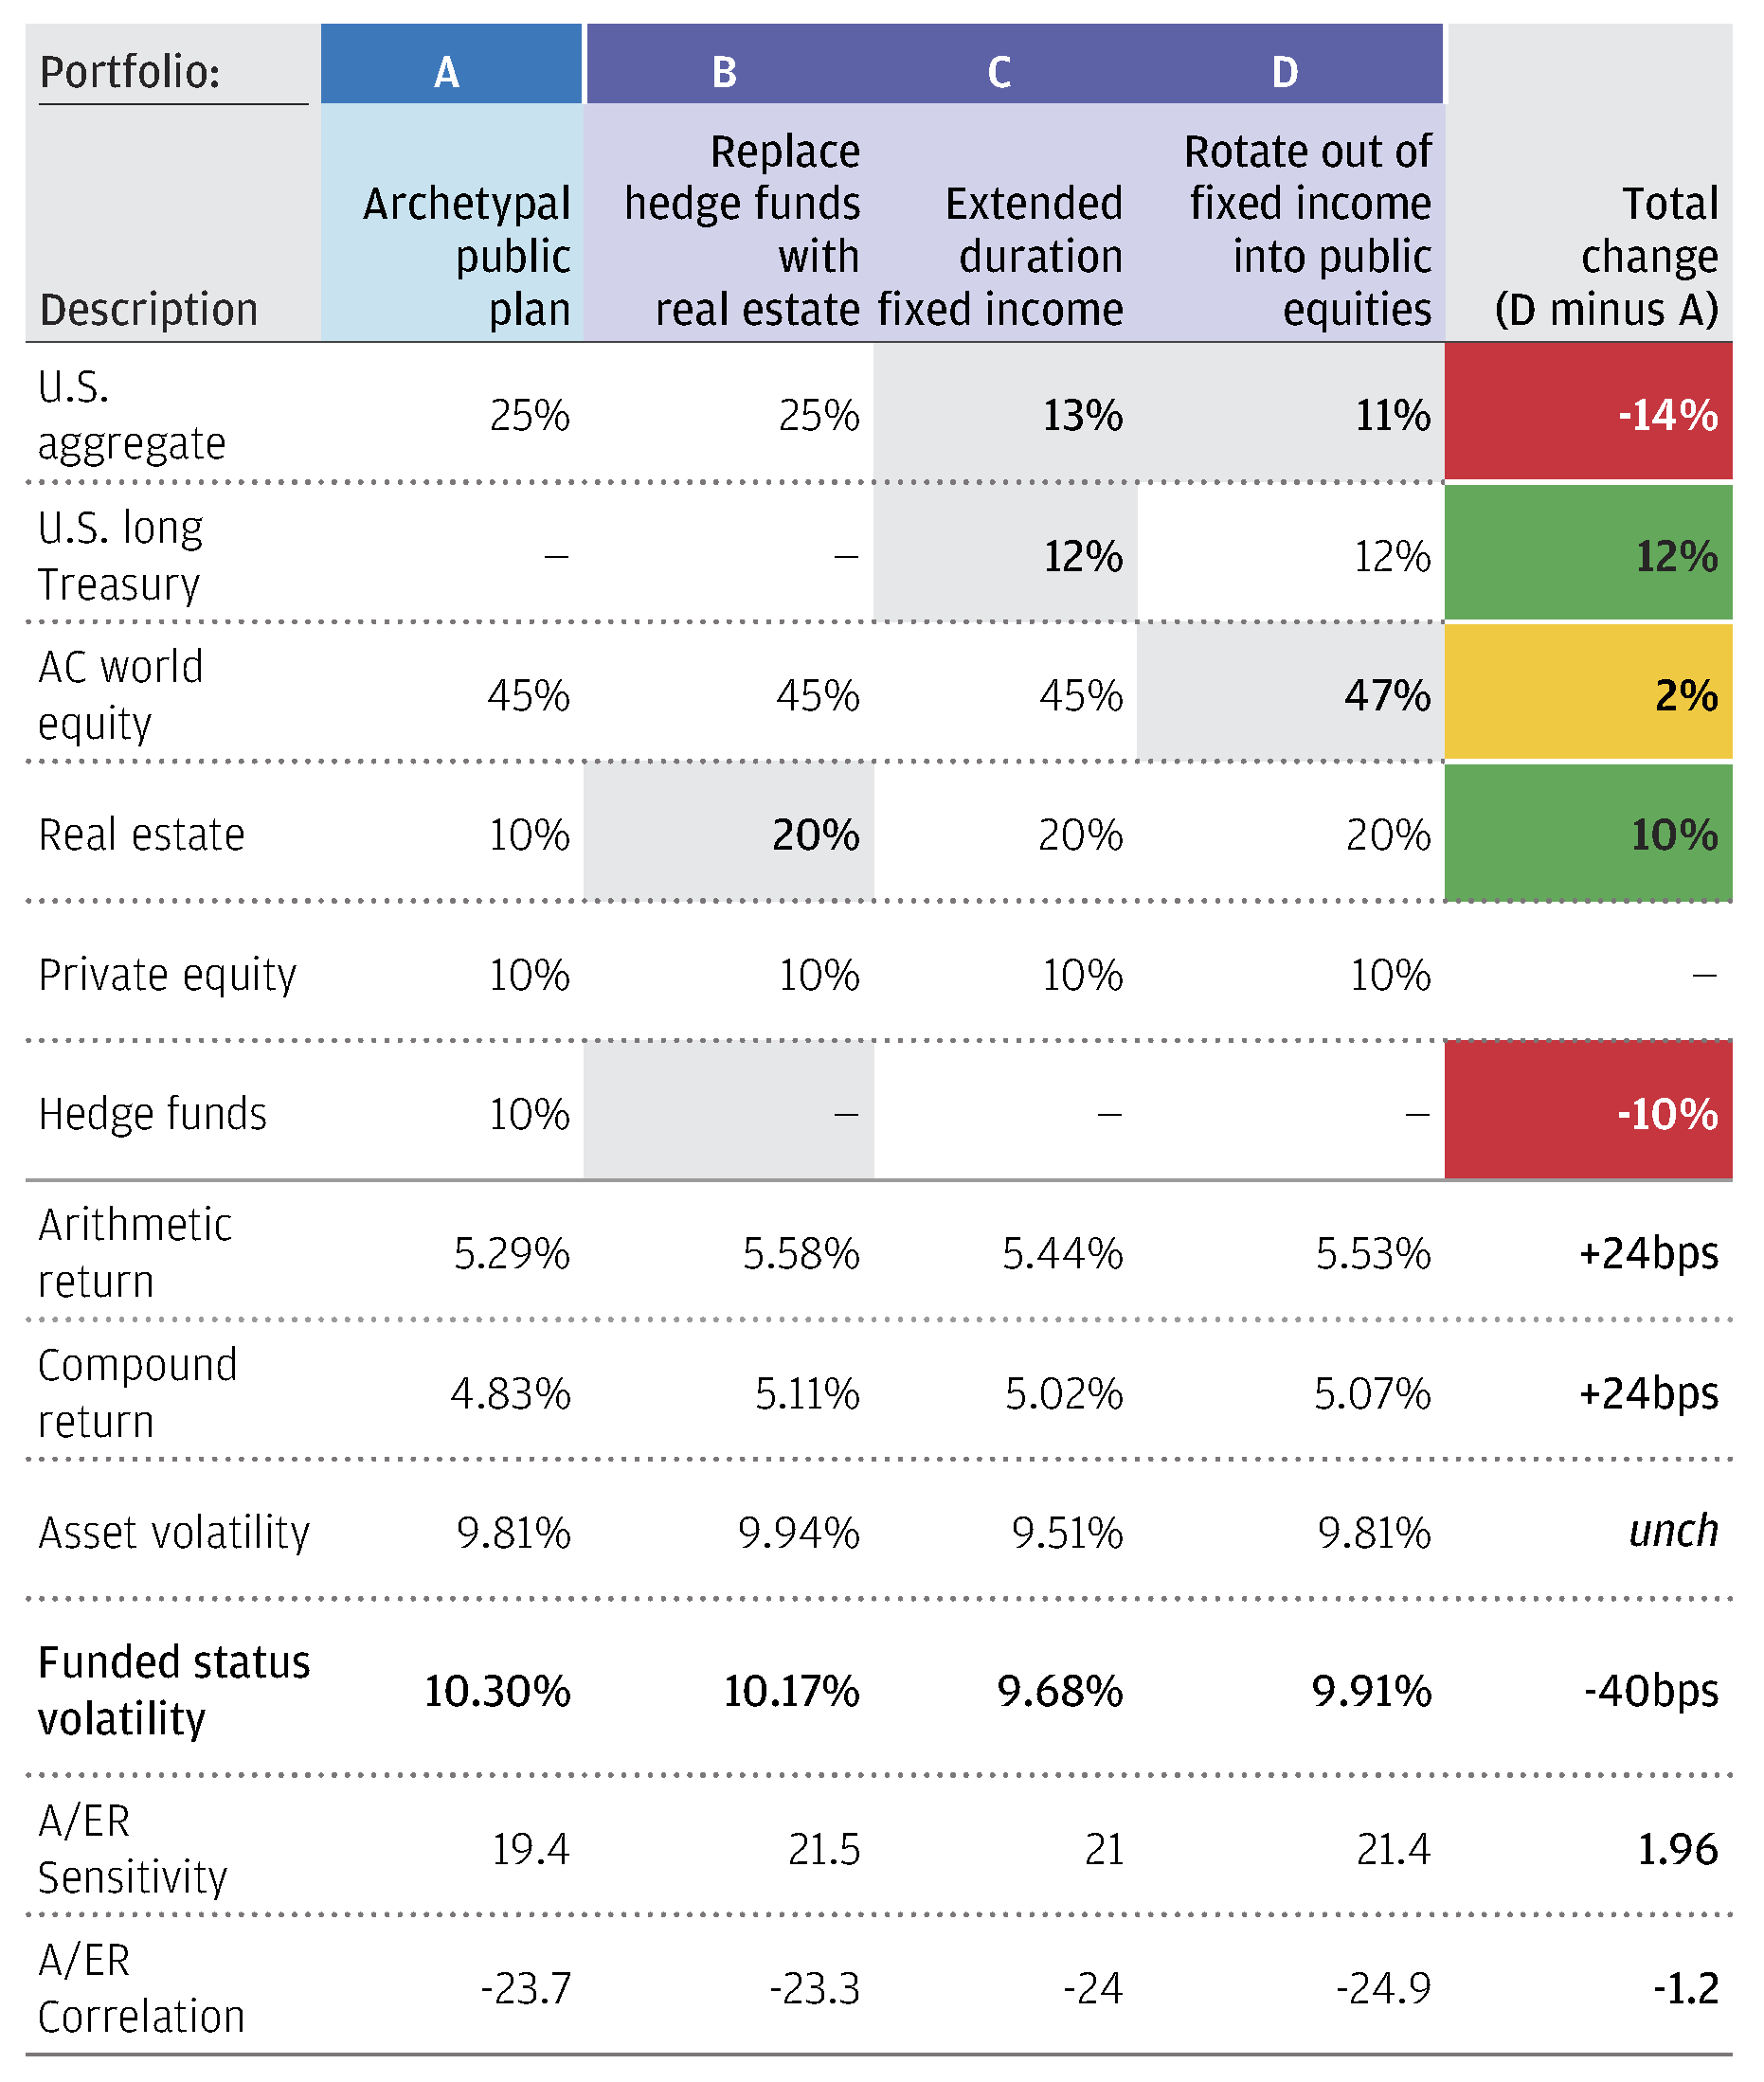
Rather than survey asset class characteristics in a silo, we now consider how they might interact in a total portfolio context (Exhibit 9). We begin with an archetypal public plan portfolio (return expectations are “beta-only” and so fall short of a typical public plan expected return assumption), roughly approximating the average public plan allocation4, and formulate asset class substitutions that align with our exploration of LAI characteristics:
- Portfolio B—Replace hedge funds with real estate: Hedge funds and other “cash plus” strategies are less efficient in LAI than the asset-only space. Despite increasing asset volatility, this reallocation dampens funded status volatility by boosting the A/ER Sensitivity.
- Port C—Extend fixed income duration: Redirecting half the U.S. aggregate allocation to long duration bonds improves the portfolio’s A/ER Correlation and further reduces funded status volatility.
- Portfolio D—Rotate out of fixed income into public equity: An additional 2% shift into public equity from U.S. aggregate increases A/ER Sensitivity and reduces A/ER Correlation, boosting returns in exchange for a moderate increase in funded status volatility.
Increasing liability awareness
Exhibit 9: Portfolio reallocations to boost return and reduce funded status volatility at the same level of asset volatility
Source: J.P. Morgan Asset Management. Archetypal portfolio based on data from Public Plans Database. For illustrative purposes only.
In aggregate, these allocation shifts reposition the portfolio to reduce funded status volatility at the same level of asset volatility while simultaneously increasing return expectations. Different sets of projected assumptions and application to a broader investment opportunity set will inevitably lead to different solutions, but in practice the LAI framework can facilitate a careful balance between funded status volatility, asset volatility and expected return.
In the appendix to this paper, we explore how other plan characteristics may influence portfolio construction through an LAI lens. These topics include low risk/return portfolios, varying the liability PV1 and investing against real, rather than nominal, liabilities.
Putting it all together: LAI takeaways
What does this all mean and how can plan sponsors benefit from an LAI framework? We believe that an LAI framework should augment current practice rather than entirely replace it. While the funded status volatility measure does redefine the “low risk” portfolio, the allocation implications are only moderate in the range of current return targets. This parallels to the corporate pension world, where even dyed in the wool LDI believers need to run what amounts to total return driven portfolios if their return needs are high enough. However, by integrating and socializing the concept of funded status volatility, they have built a framework for measuring risk, quantifying the impact of allocation and market outlook changes as well as a roadmap for how to reimagine the portfolio as the needs of the plan and asset class expected returns evolve. While the preceding analysis and formulation of A/ER Sensitivity and Correlation characteristics have been derived from historical data, capital market forecasters can make projections of these metrics directly, informed by their secular and structural market outlook. The LAI framework also gives credence to rebalancing while confronting market volatility. Not only are you “buying low” and “selling high,” but also curbing liability values on the opposite side of the plan balance sheet. The LAI framework gives us not a radical overhaul of current practice, but an additional tool to measure risk. If plan sponsors want to maximize their chances of beating their liabilities, they must keep track of the score.
Appendix
Exploration of special considerations for the interested reader
Despite its length, we have really only scratched the surface of LAI and its implications. In the following paragraphs, we quickly address some questions and concerns that we were asking of ourselves.
1) Is there specific analytical support for LAI funded status volatility drivers?
In this section, we provide formulations of the asset class characteristics that drive funded status volatility. In addition to the liability PV1:
- A/ER Correlation measures the correlation between the realized return and subsequent change in expected return. The closer this metric is to -100 (perfect negative correlation), the lower funded status volatility, all else equal.
- A/ER Sensitivity measures the ratio of the volatility of assets to the volatility of expected return changes. For most portfolios, higher metrics lead to lower funded status volatility, all else equal. For a perfectly immunized portfolio, the A/ER Sensitivity must equal the liability PV1.
- Asset volatility is also a driver of funded status volatility. All else equal (e.g., A/ER Correlation and Sensitivity are unchanged), higher asset volatility leads to higher funded status volatility.
Under what conditions might our stylized example from Exhibit 4, a perfectly immunized LAI portfolio, actually be possible? We promise these are the only formulas in the paper, and we consent to showing them only because their implications are fairly intuitive. Firstly, the change in expected return must be entirely explained by the realized asset return—they must have perfect negative correlation (formula A—correlation property that we will refer to herein as “A/ER Correlation” short for asset/expected return correlation). Secondly, the asset volatility must be proportional to the liability volatility, which is a function of the liability PV1 and volatility of EROA changes (formula B—return sensitivity property that we will refer to herein as “A/ER Sensitivity”). Absent this property, assets and liabilities may move in the same direction, but with different magnitudes leading to funding volatility. This is analogous to fixed income duration, where we measure the ratio of total return to the change in underlying yield level, and helps explain why an A/ER Sensitivity equivalent to the liability PV1 will minimize funded status volatility.
Exhibit A: Conditions under which funded status is perfectly immunized

Finding an asset class or building a portfolio with this combination of characteristics is impractical, if not impossible. But these properties can guide us directionally as to which asset classes might dampen funded status volatility and which asset classes might exacerbate it. Those assets whose return expectations are more reactive to patterns of realized return (A/ER Correlation), and those where the proportion of asset volatility to EROA change volatility (A/ER Sensitivity) are more in line with the liability PV1, will be smaller contributors to funded status volatility, all else equal. In fact, we can generalize the ideal conditions to a more broadly applicable property of the LAI framework:
Exhibit B: Generalized conditions under which funded status volatility is minimized

You may recognize this as the slope or beta of a linear regression, similar to the beta of a portfolio to the market. Thus, when A/ER Correlations are greater than -100, which will almost certainly always be the case, A/ER Sensitivities greater than the liability PV1 will tend to be LAI risk reducing.
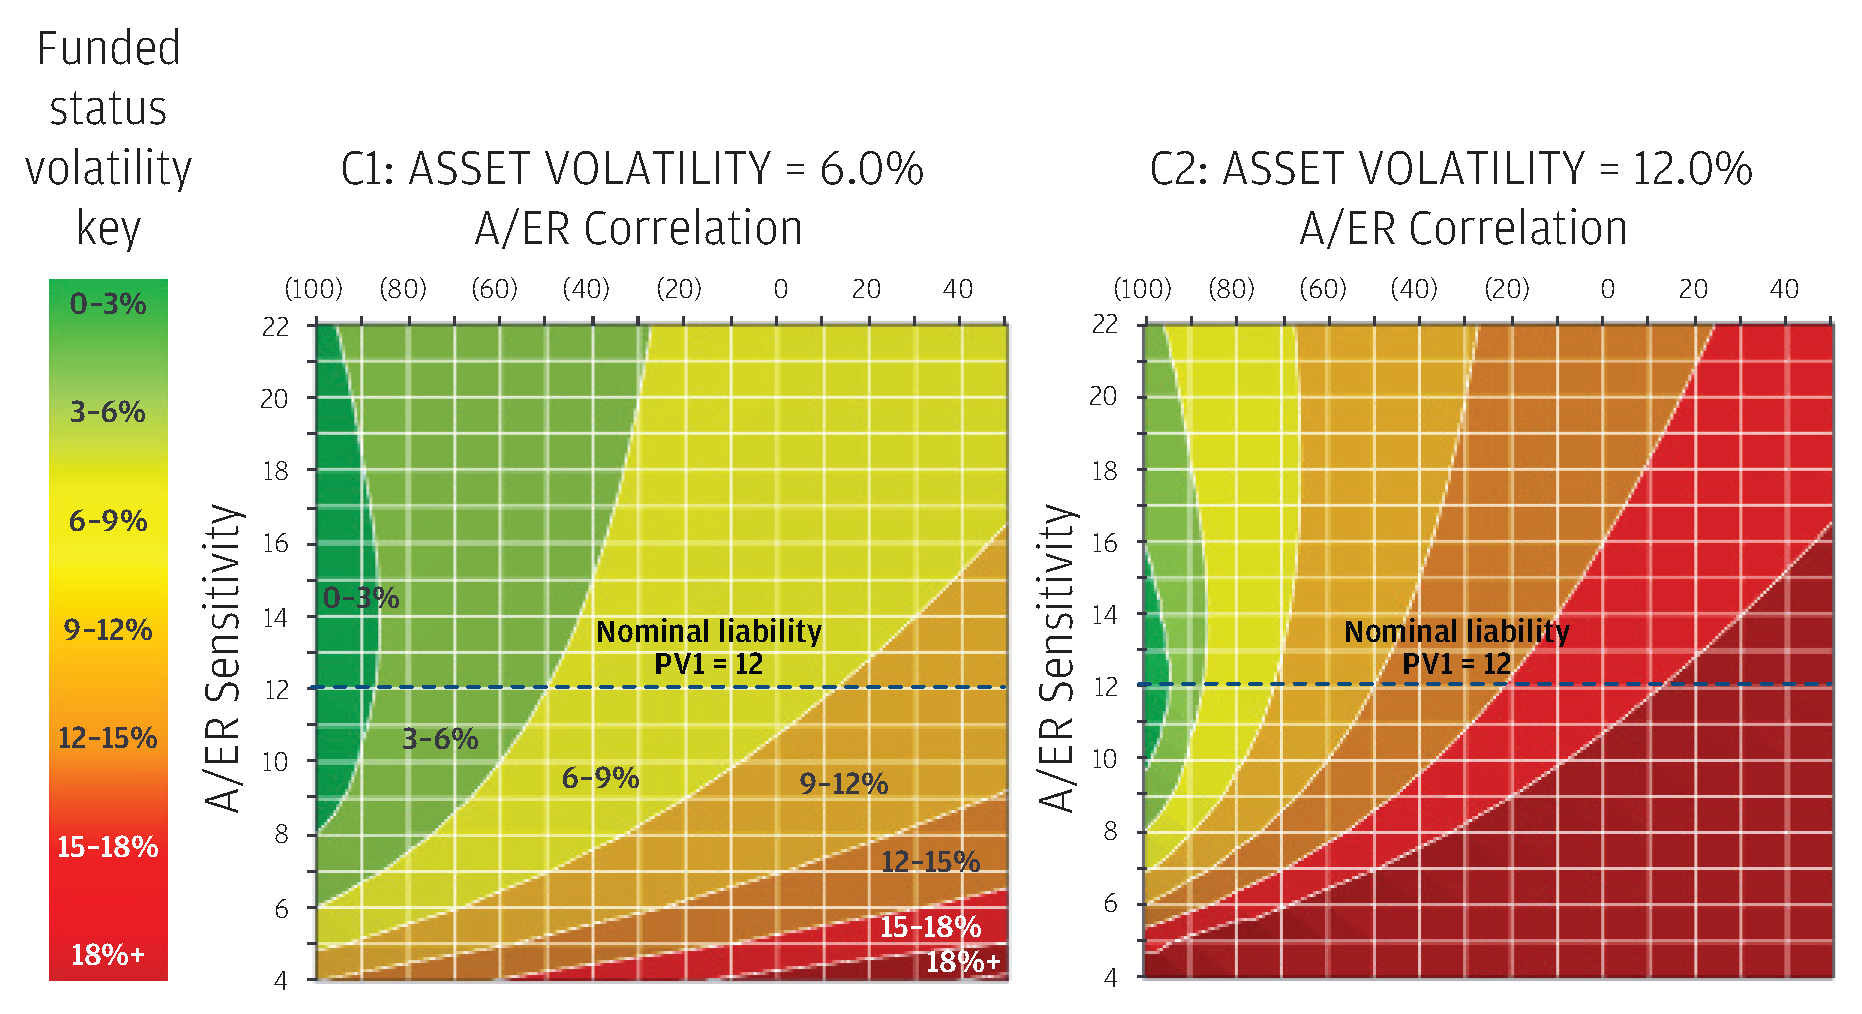
To explore the contours of these properties more holistically, Exhibit C plots funded status volatility as a function of A/ER Correlation, A/ER Sensitivity and a fixed level of asset volatility.
Lower A/ER correlation, higher A/ER sensitivity and lower asset volatility generally lead to lower funded status volatility
Exhibit C: Funded status volatility as a function of A/ER correlation & A/ER sensitivity at 6% and 12% asset volatility
Source: J.P. Morgan Asset Management. For illustrative purposes only.
From these contour plots we can visualize previously described axioms and generate additional insights about the LAI framework properties:
- Minimum funded status volatility: Funding risk is minimized when A/ER Correlation equals -100 and A/ER Sensitivity is in line with liability PV1.
- Correlations: Higher (lower) A/ER Correlations lead to higher (lower) funded status volatility, all else equal. As A/ER Correlations increase from -100, higher A/ER Sensitivity tends to reduce funded status volatility.
- Asset volatility: Higher asset volatility leads to higher funded status volatility and increased sensitivity to changes in A/ER Correlation and Sensitivity, all else equal.
Importantly, not all sections of the contour plot are feasible in the sense that no asset classes or portfolios exhibit every possible combination of characteristics. We dig deeper into this idea in the body of paper where we explore LAI characteristics of individual asset classes and portfolios.
2) How does the LAI framework change for plans with CPI-driven COLAs or risk-sharing mechanisms?
According to National Association of State Retirement Administrators, nearly half of public plans have an automatic COLA linked to inflation and about 15% have a conditional COLA5, a risk-sharing mechanism that links COLA benefits to investment performance or funded status levels. To the extent that risk sharing is conditional upon funded status levels, an LAI framework that reduces funded status volatility will ipso facto lead to more stable COLA applications. However, real liabilities will impact our funded status volatility measurements. All else equal, having any type of COLA will generally lead to higher levels of liability PV1 as longer-dated cash flows grow with compounding adjustments. But real liabilities also fundamentally alter the LAI characteristics of each asset class.
Exhibit D calculates the funded status volatility of each asset class for a set of real versus nominal pension liabilities. It’s important to note that this analysis covers a historical period of low levels and low volatility of inflation. In fact, the majority of years over this period exhibit no change in inflation expectations. Furthermore, none of the asset classes in the opportunity set have exhibited returns that correlate highly with inflation changes (while short duration TIPS and certain commodities segments do, these asset classes represent full maturity TIPS and the broader commodity complex, respectively).
Asset classes with inflation linkage like commodities fare better against real liabilities
Exhibit D: Asset class funded status volatility for real versus nominal liabilities

Source: J.P. Morgan Asset Management; data as of September 30, 2020.
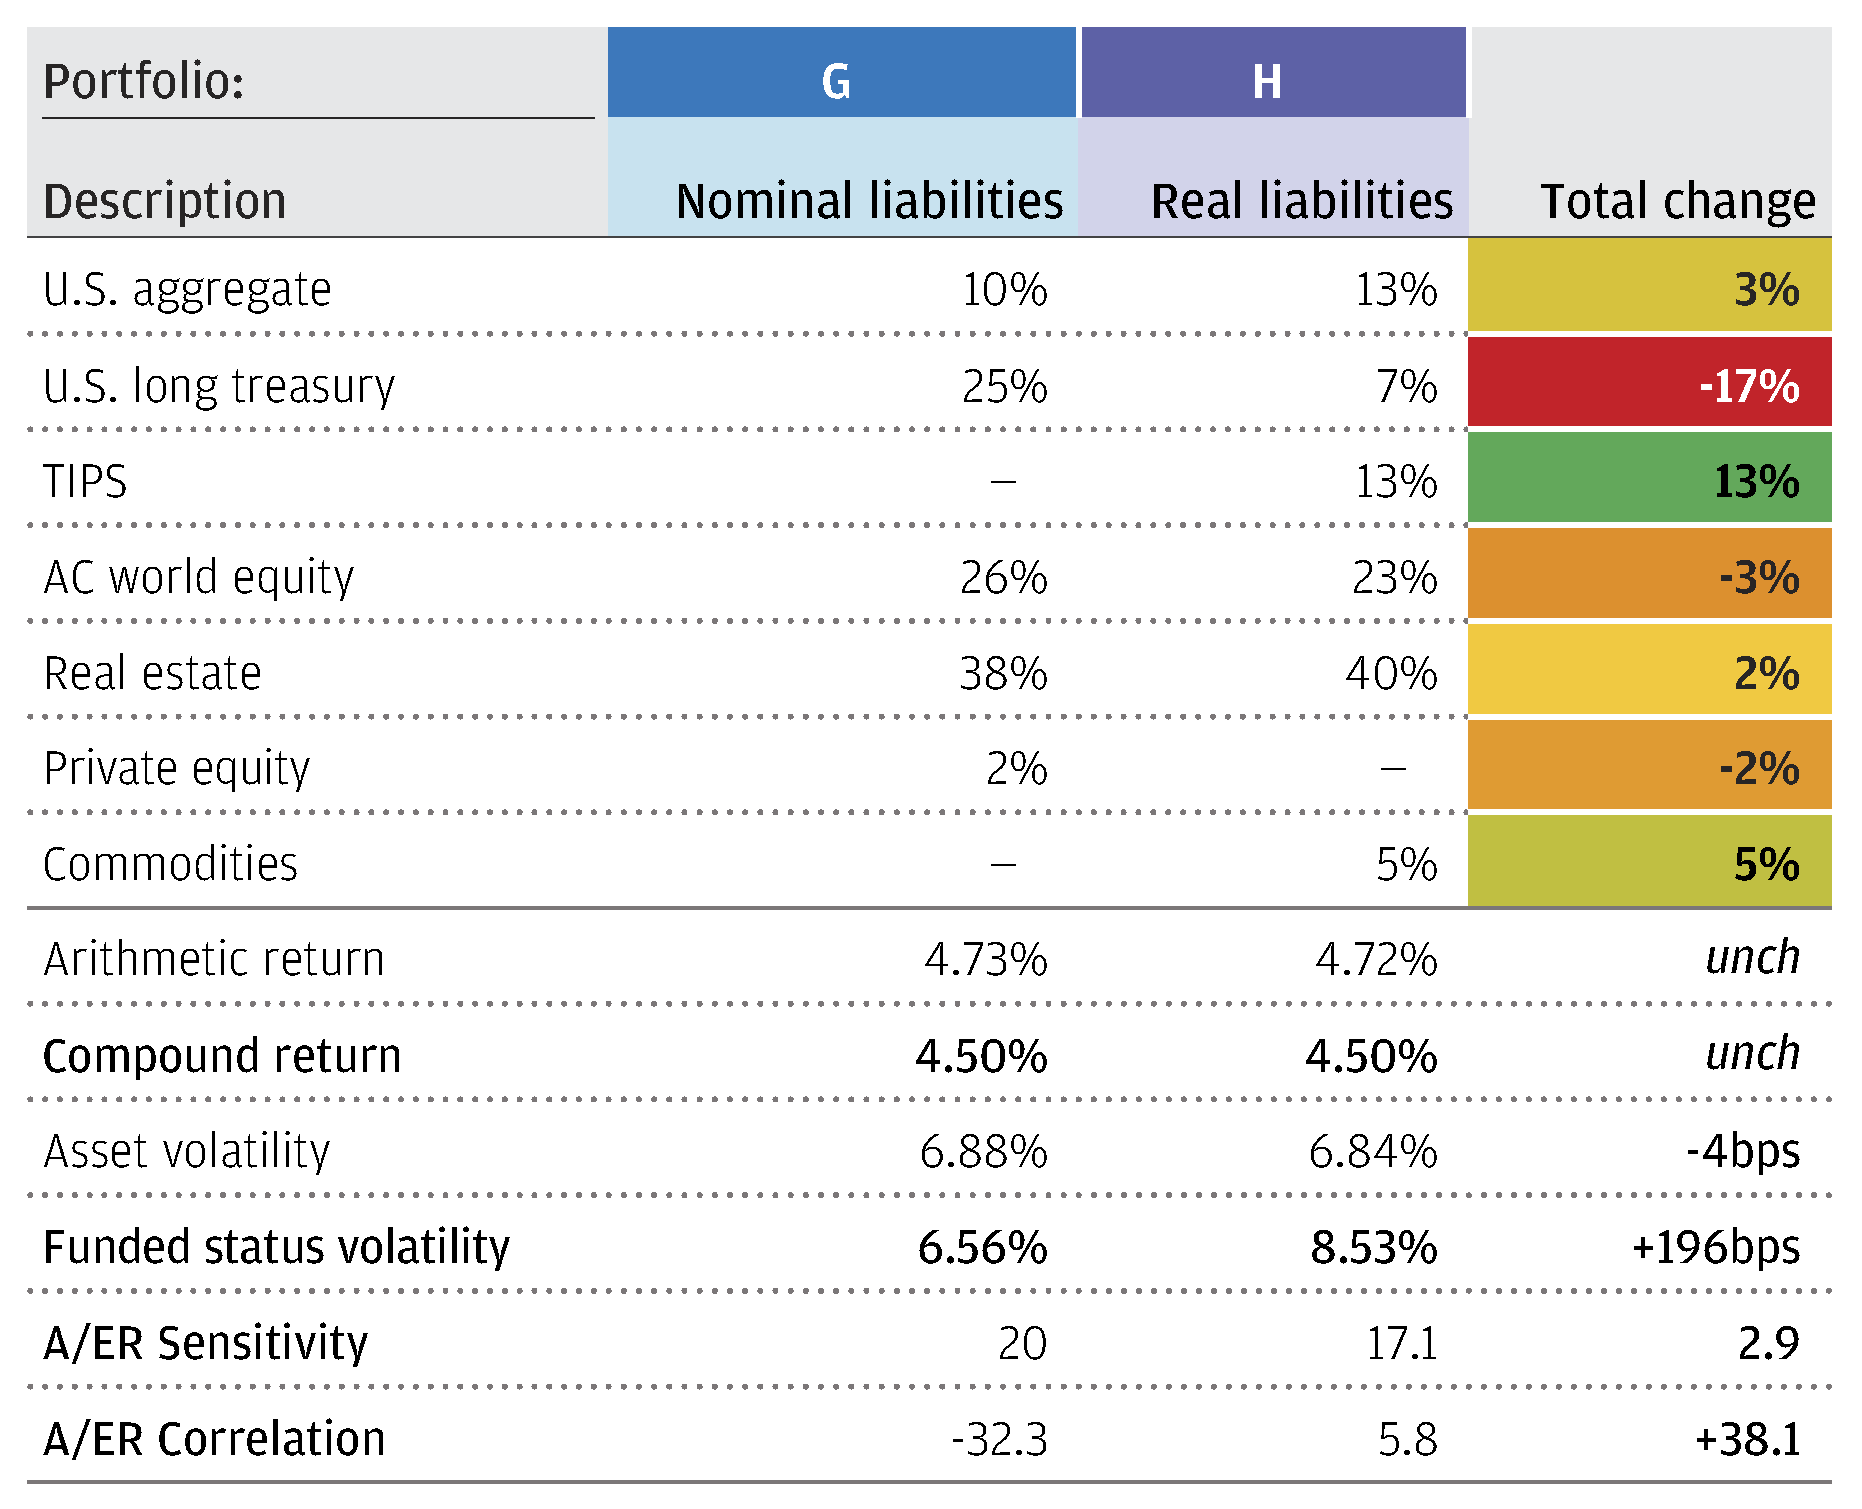
In combination, these features result in broadly higher A/ER Correlation levels across most asset classes leading to higher levels of funded status volatility at similar return targets. Exhibit E compares a 4.5% return portfolio that minimizes funded status volatility against both nominal (Portfolio G) and real (Portfolio H) liabilities. We see that Portfolio H favors TIPS, real estate and commodities and significantly reduces the allocation to long duration bonds. A/ER Correlation is significantly higher and positive, while funded status volatility is almost 200bps higher. This suggests that favored asset classes aren’t necessarily attractive in real LAI space, but merely the least unattractive.
Portfolios G and H are constrained optimizations that minimize funded status volatility at a 4.5% expected return target. The sum of private equity and real estate is capped at 40% total, and all asset classes shown are eligible in the analysis.
Exhibit E: Real liabilities increase attractiveness of commodities, tips and real estate
Source: J.P. Morgan Asset Management. For illustrative purposes only.
3) What is the impact of varying the liability PV1?
Liability PV1 is most often a function of plan demographics (e.g., how many active participants relative to retirees), which is a major driver of plan net cash flows and ultimately informs the need for income and illiquidity tolerance. However, unlike corporate pension LDI, current public pension asset allocation methods have virtually no direct relationship to liability PV1. A plan with an 8-year liability PV1 and a 16-year liability PV1 may very well be running the same exact portfolios, given the same return targets.
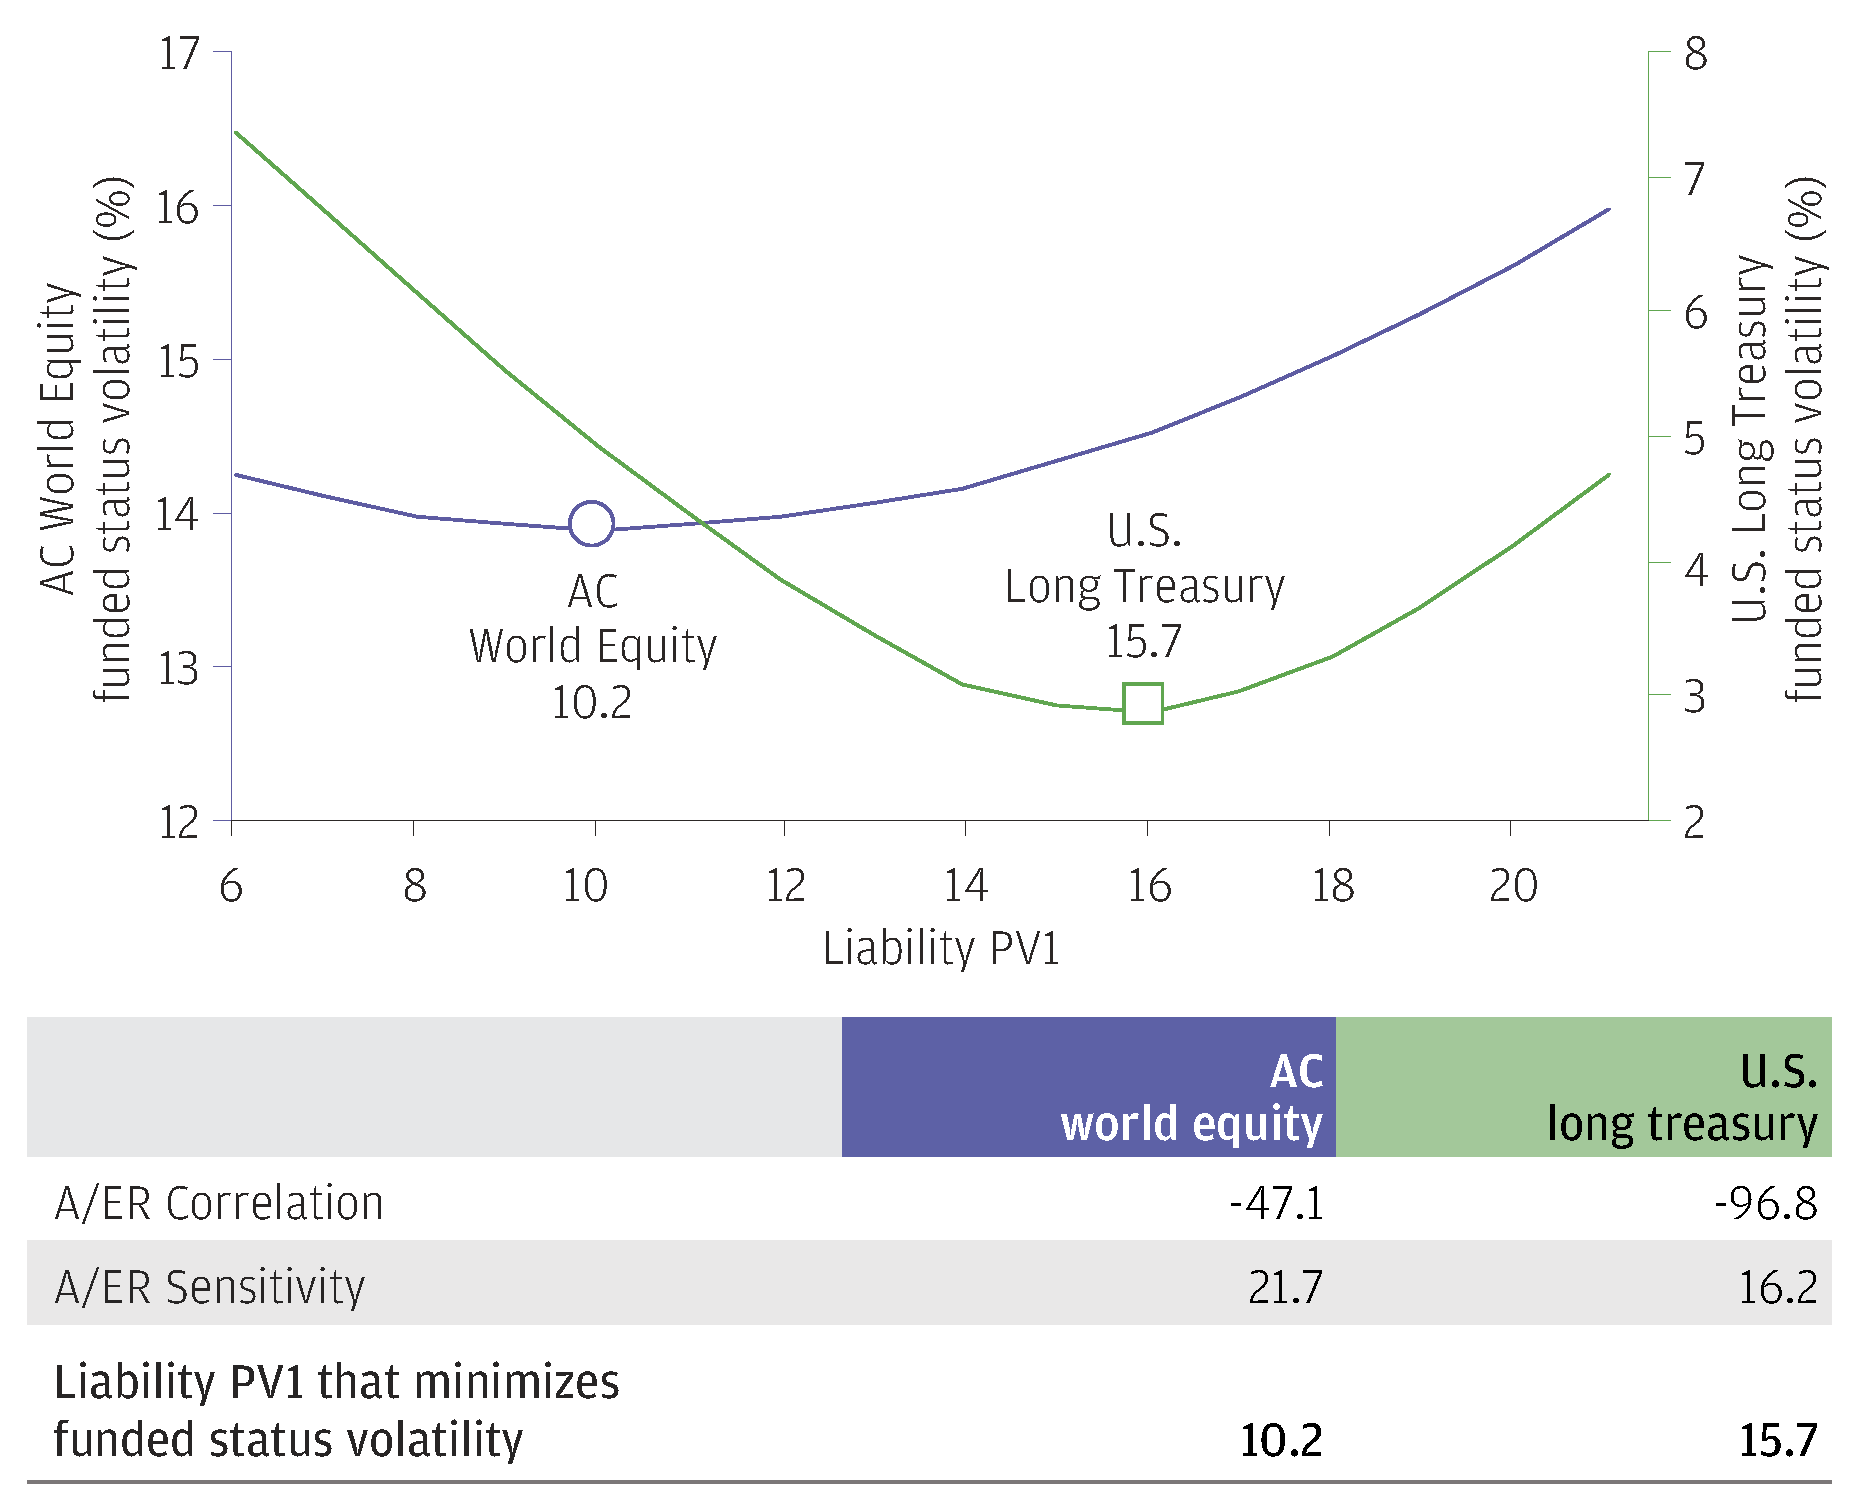
To begin, we examine how the funded status volatility of individual asset classes is impacted by changes in liability PV1. Recall that in Exhibit B we asserted that funded status volatility is minimized when:
-A/ER Correlation * A/ER Sensitivity = PV1Liability
Exhibit F plots the funded status volatility of AC world equity and U.S. long treasury and finds that this formula holds true. Thus, higher levels of liability PV1 support the use of portfolios that exhibit higher A/ER Sensitivity, lower A/ER Correlation or some combination of the two.
PV1 impacts optimal levels of A/ER sensitivity and correlation
Exhibit F: Impact of changing liability PV1 on funded status volatility
Source: J.P. Morgan Asset Management. For illustrative purposes only.
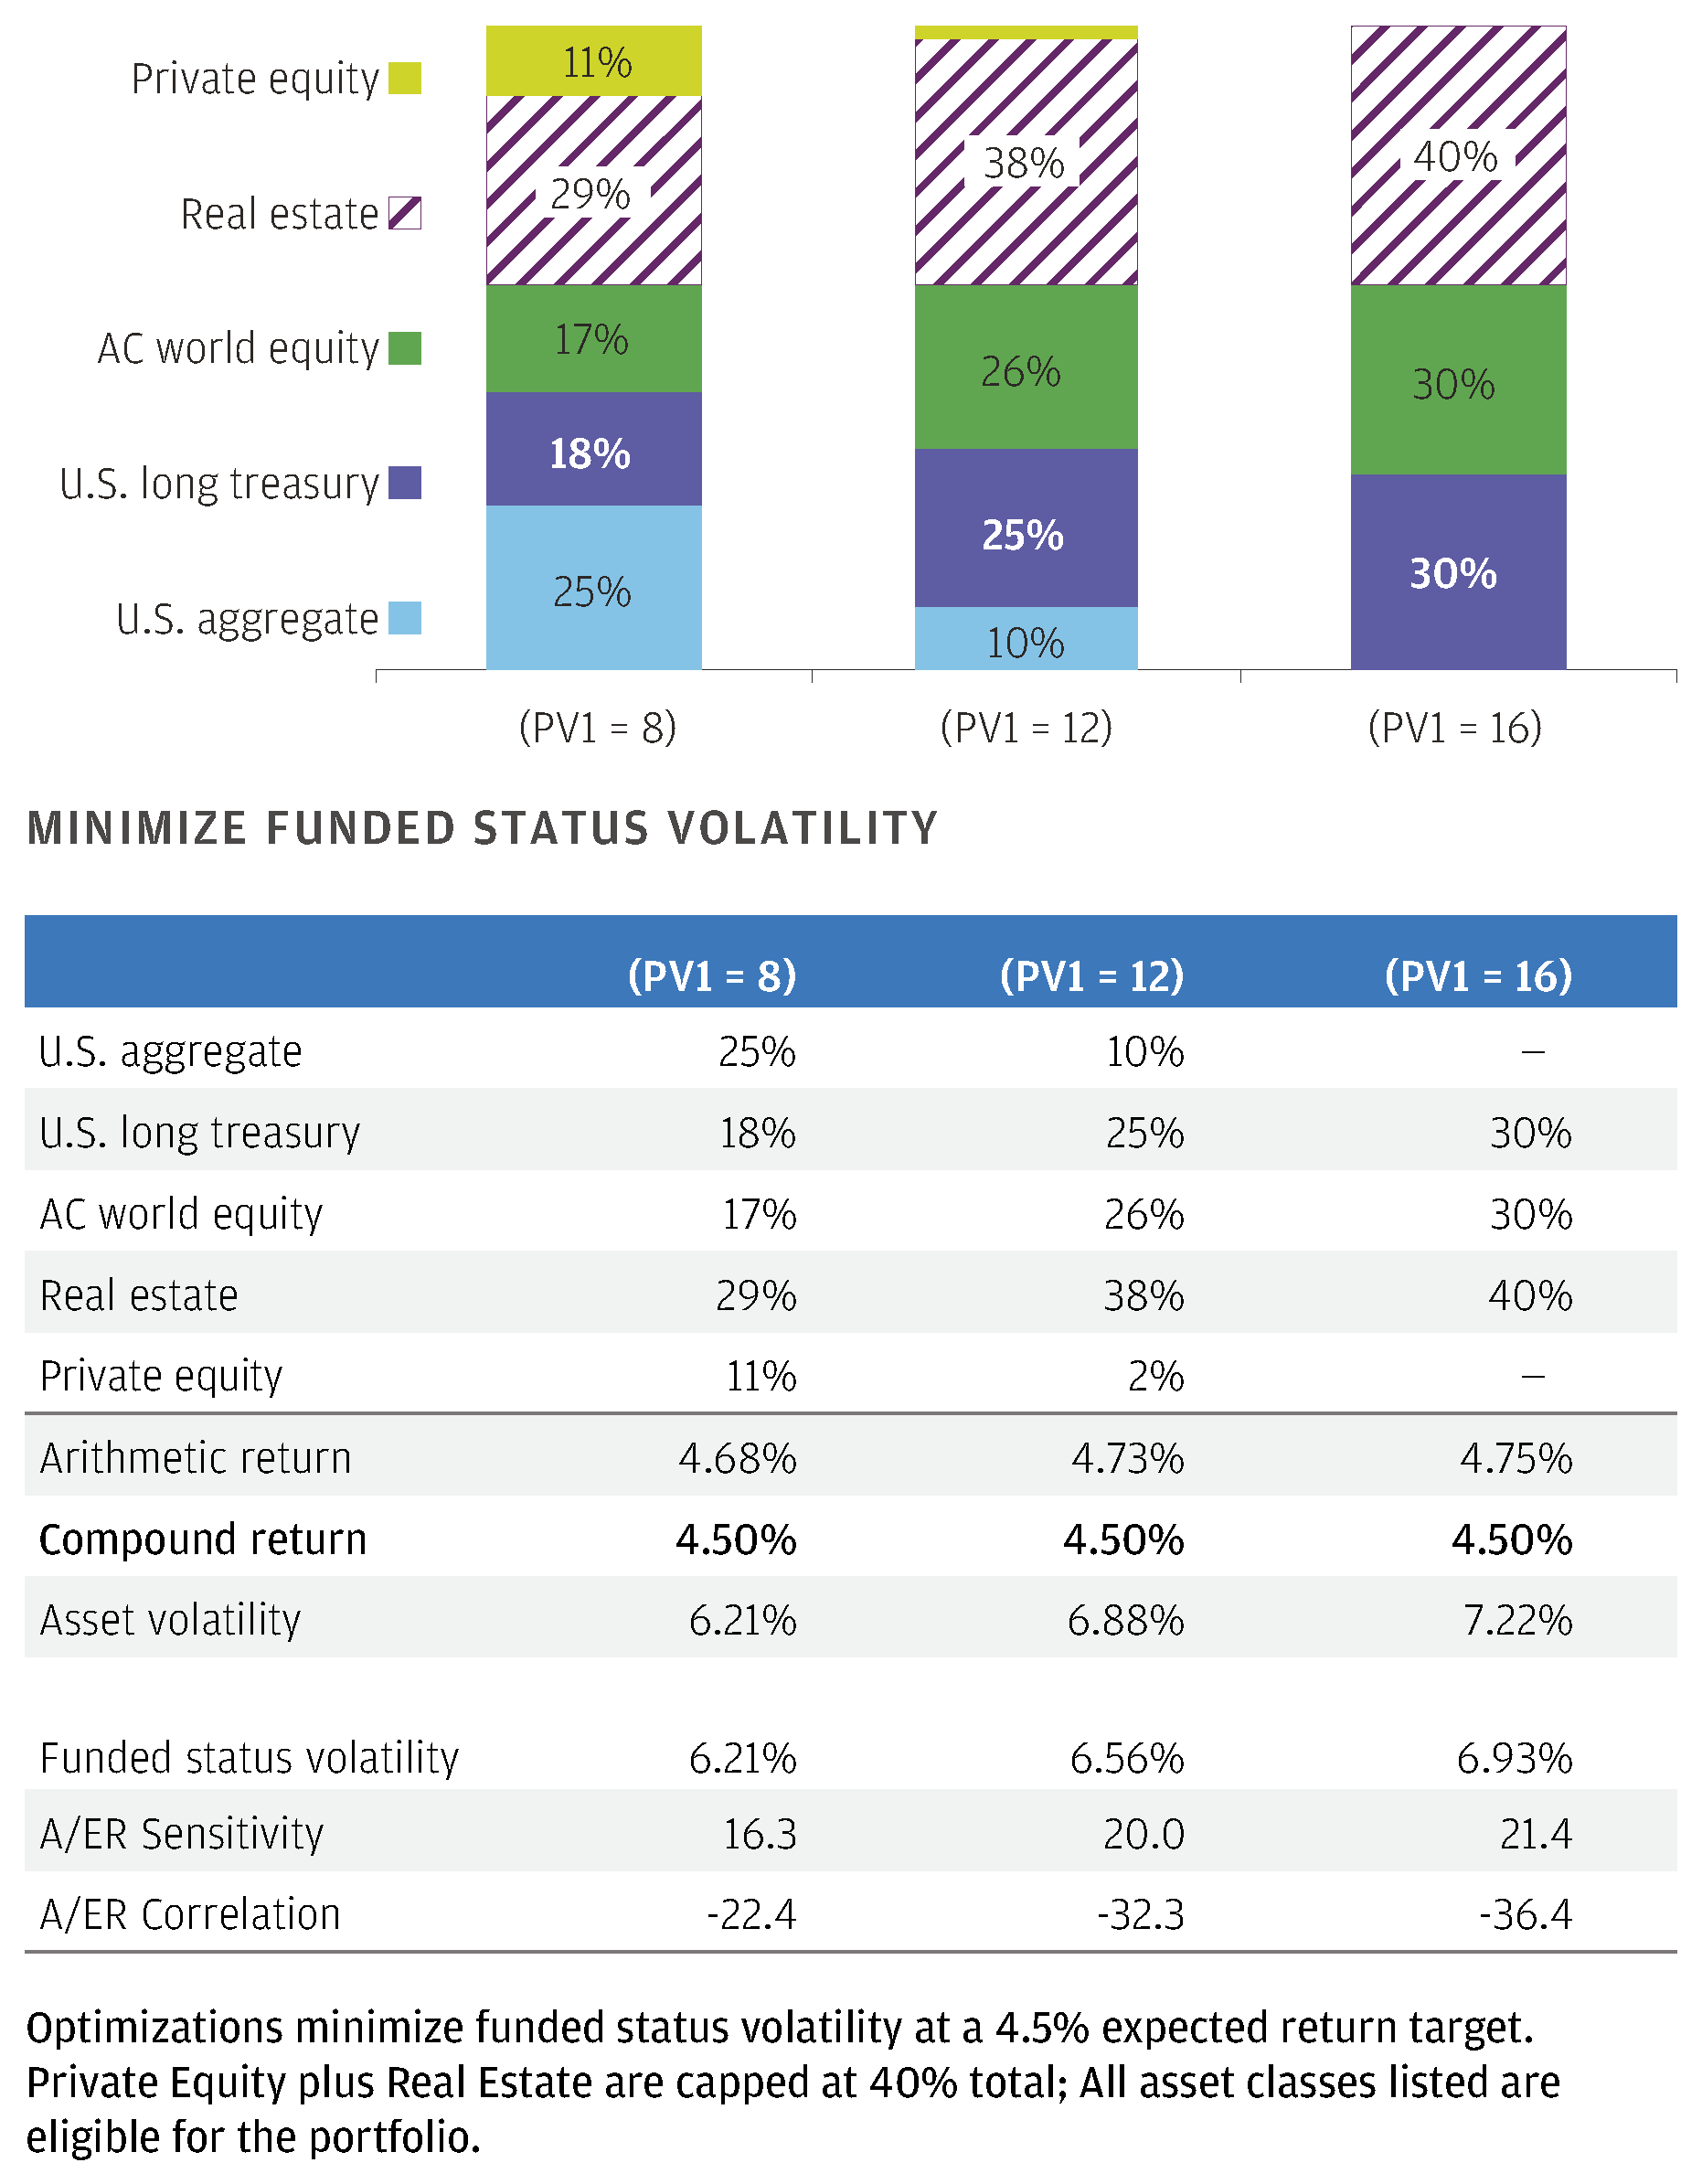
Broadening to a total portfolio, Exhibit G outlines 4.5% return portfolios that minimize funded status volatility for public plans of varying liability PV1 levels. These are constrained optimizations but clearly illustrate that higher PV1 liabilities favor portfolios with higher A/ER Sensitivity, just as we would suspect. Long duration bonds are favored over core bonds, public equity is favored over fixed income and real estate is favored over private equity. Thus, as liability PV1 increases, higher A/ER Sensitivity and lower A/ER Correlation assets become relatively more attractive and crucial for controlling funded status volatility. It is also the case that, all else equal, higher PV1 liabilities will dictate higher levels of funded status volatility at similar return levels.
Portfolio risk more sensitive to LAI characteristics as liability PV1 increases
Exhibit G: Optimized 4.5% return portfolios varying by liability PV1 level
Source: J.P. Morgan Asset Management. For illustrative purposes only.
4) Most plans are underfunded. How does this impact portfolio construction under LAI?
LAI can be additive for plans whether they are overfunded or underfunded. For simplicity, our previous examples have all assumed that the target plan was 100% funded. By definition, the size of assets has no impact on the fundamental LAI driving characteristics we have outlined: A/ER Correlation, A/ER Sensitivity and asset volatility. Rather, a lower funded status is functionally equivalent to having a higher liability PV1. All else equal, a more underfunded plan would benefit by seeking out assets with a higher A/ER Sensitivity and lower A/ER Correlation, to offset the impact of having a lower asset base (see Appendix Q2: What is the impact of varying the liability PV1?). This turns out quite nicely as it leads lower funded plans to the generally higher returning assets that provide leveraged A/ER Sensitivity exposure, like public equity, and are needed to close funding gaps.
5) What are the implications of asset smoothing in actuarial funded status?
The tension between economic and smoothed valuations is a feature of nearly every actuarial profession and industry. For both corporate and public pensions, the various smoothing mechanisms for accounting and funding allow plans to take on more funded status volatility than they otherwise would tolerate. Actual performance relative to expectations is recognized slowly over time rather than immediately, meaning that significant underperformance won’t immediately spike contribution requirements or pension cost accounting.
The funded status volatility of a plan that smooths asset returns over long periods of time (e.g., five years or longer for funding purposes) and never adjusts the liability discount rate will be quite low and difficult to reduce with a more mark-to-market framework, except at very low risk levels. However, when asset smoothing is applied over a shorter time period or discount rates are more reactive to changes in capital market assumptions, the practice can actually introduce funded status volatility. Using our LAI framework, asset smoothing distorts and worsens the correlation between realized returns (in the way they impact smoothed asset values) and changes in forward expected returns (A/ER Correlation) and by reducing realized asset volatility, thus in turn reducing the A/ER Sensitivity. Therefore, plans embracing a more dynamic liability valuation mechanism may want to consider using a market valuation of assets for funding purposes. However, over the long term, the economic outcomes dominate the smoothing effects. In this way a plan can continue to smooth assets and limit expected return changes for funding purposes while building portfolios and monitoring funded status within an integrated LAI framework.
6) What happens to portfolio construction at lower expected return targets?
At high levels of expected return, the need for large allocations to the same high returning asset classes masks some of the differences between an asset volatility and funded status volatility focused portfolio. However, at lower return targets, portfolio solutions meaningfully diverge from one another.
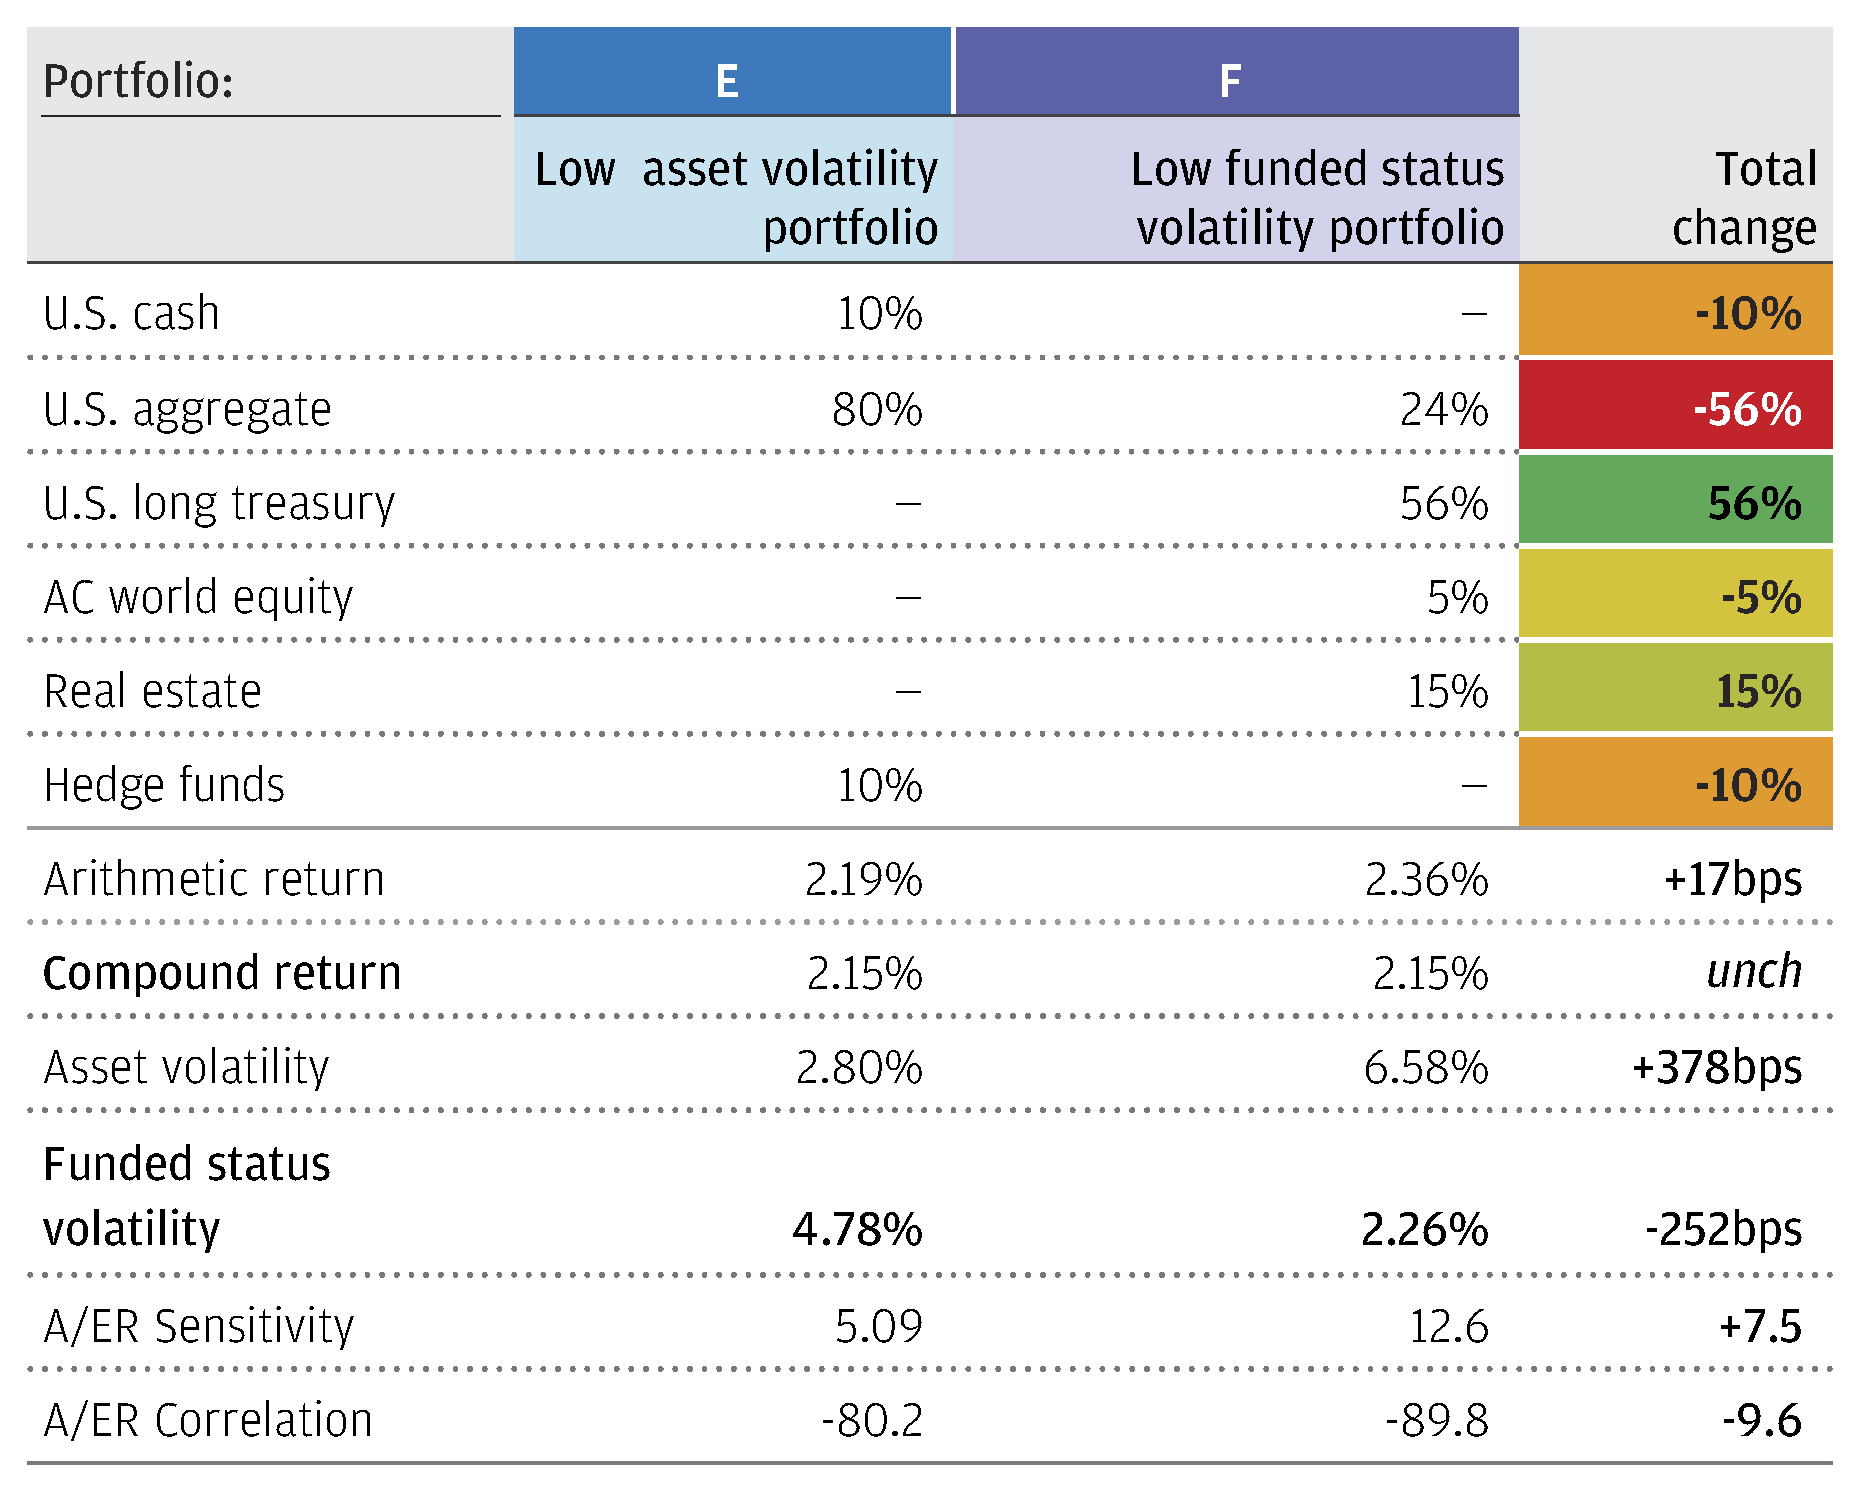
Exhibit H compares a genericized low volatility portfolio (Portfolio E) with a low funded status volatility portfolio (Portfolio F), both at a 2.15% expected return target. Compared to Exhibit 9, the differences are more pronounced, both in portfolio composition and magnitude of risk metrics. Interestingly, Portfolio E has a funded status volatility that is more than 2x the asset volatility. Portfolio F avoids cash and hedge funds in favor of long Treasury, real estate and even a 5% allocation to public equity. The end result is a significant improvement in A/ER Sensitivity and A/ER Correlation resulting in a 250bps reduction in funded status volatility.
Asset-only and LAI portfolios diverge meaningfully at lower returns
Exhibit H: Optimized 2.15% return portfolios in asset-only and LAI frameworks
Source: J.P. Morgan Asset Management. For illustrative purposes only.
1 In an environment where capital market assumptions were closer to accounting discount rates, we might expect this framework to produce more meaningful allocation differences. However, under current assumptions targeting, for example, a 7.0% return leaves little room for maneuvering. Similarly, differences between the minimum funded status volatility and minimum asset volatility portfolio can be expected to increase as the return target is reduced.
2 JPMorgan’s Long-Term Capital Market Assumptions are as of September 30 of each year.
3 In this case, valuation could still be a drag on EROA assumptions (e.g., a negative valuation impact), but on a relative basis the valuation impact would be improved. We should also note that we’re considering all other return building blocks are static. For example, the market drawdown was driven by some structural impact like change in long-term growth expectations. In this case, the expected return might not improve and there would be no liability diversification.
4 Source: Public Plans Database.
5 NASRA Issue Brief: Cost-of-Living Adjustments.
09hg212806192104