The Republicans’ ripples
Global equities surged over the month, the MSCI World index up 4.5% in U.S. dollar (USD) terms in November. However, performance was very much U.S.-led, with the S&P 500 closing 5.7% higher as the Republican party’s clean sweep victory was viewed as pro-growth and market friendly via looser regulatory stand and proposed corporate tax rate cuts. Returns on other equity markets were far poorer, with European equities down 1.9% and emerging market equities dropping 3.7% in USD terms over the month. The Bloomberg Global Aggregate index gained 0.34% in USD terms in November.
Third quarter U.S. earnings also beat expectations, helping to buoy markets. Once again, tech names led the way in reinforcing the sustained artificial intelligence (AI) growth theme. Meanwhile, consumer names reported strong results and healthy retail sale prints point towards the remarkable resilience of the U.S. consumer market.
U.S. Treasuries sold off sharply following the election, as the market raised concerns over the new administration’s tax, tariffs and budget proposals in lifting fiscal deficit and inflationary risks. Yields fell back upon the nomination of Scott Bessent as Treasury secretary, as the market favoured his perceived nuanced stance on tariffs. The U.S. treasury yield curve flattened as 10-year yields ended 11 basis points (bps) lower. The Federal Reserve (Fed) made less dovish noises over the month given policy uncertainty, and markets reduced the probability of a December cut to 65%. The 10-year yields on Australian government bonds were 16 bps lower accordingly.
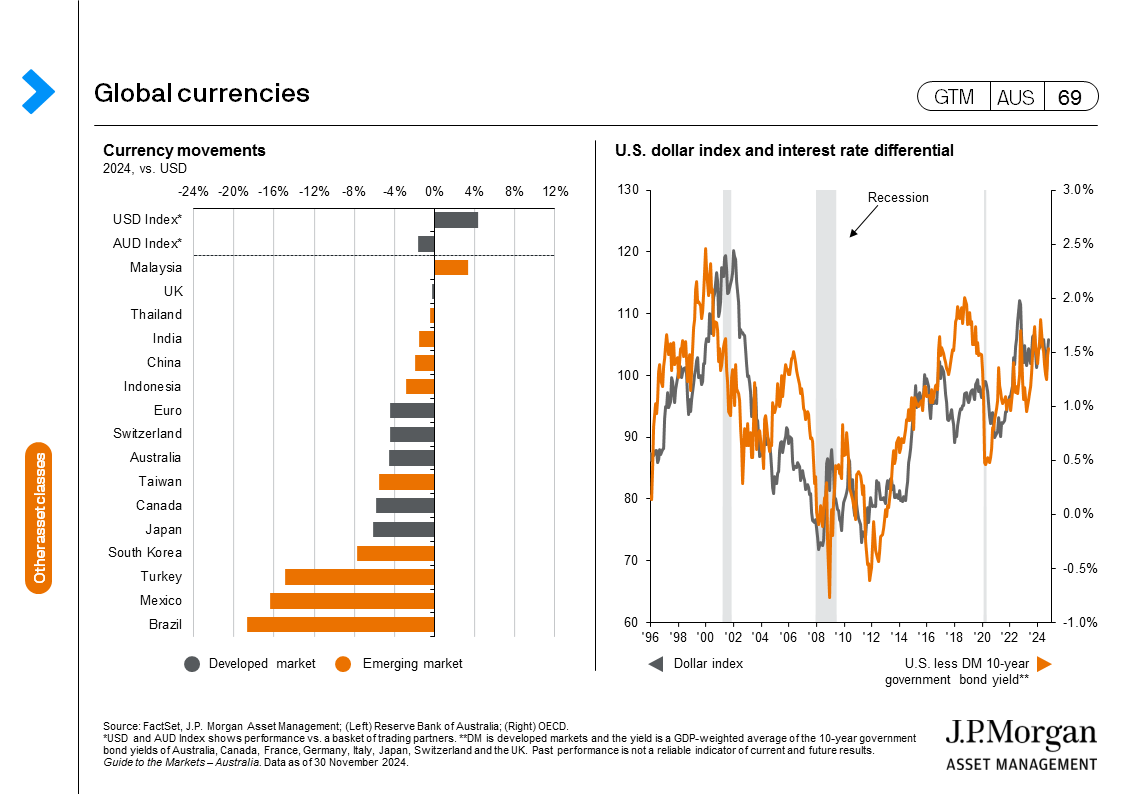
Outside of the U.S., the implications of upside inflationary risks and potential tariffs pushed most currencies lower against the USD, with the euro at -2.8%, the pound at -1.2%, the Chinese yuan at -2.8% and the Australian dollar at 0.5%. The Japanese yen was an exception, strengthening 1.4% against the USD, as the likelihood for a December hike by the Bank of Japan increases alongside further stimulus plans from the Japanese government cabinet. Stimulus from China on the other hand, has lagged market expectation on a lack of increased public spending to support domestic consumption, despite the announcement of CNY 6trillion of new bond issuances from local governments to tackle hidden debts, which was already on the upper end of consensus estimates.
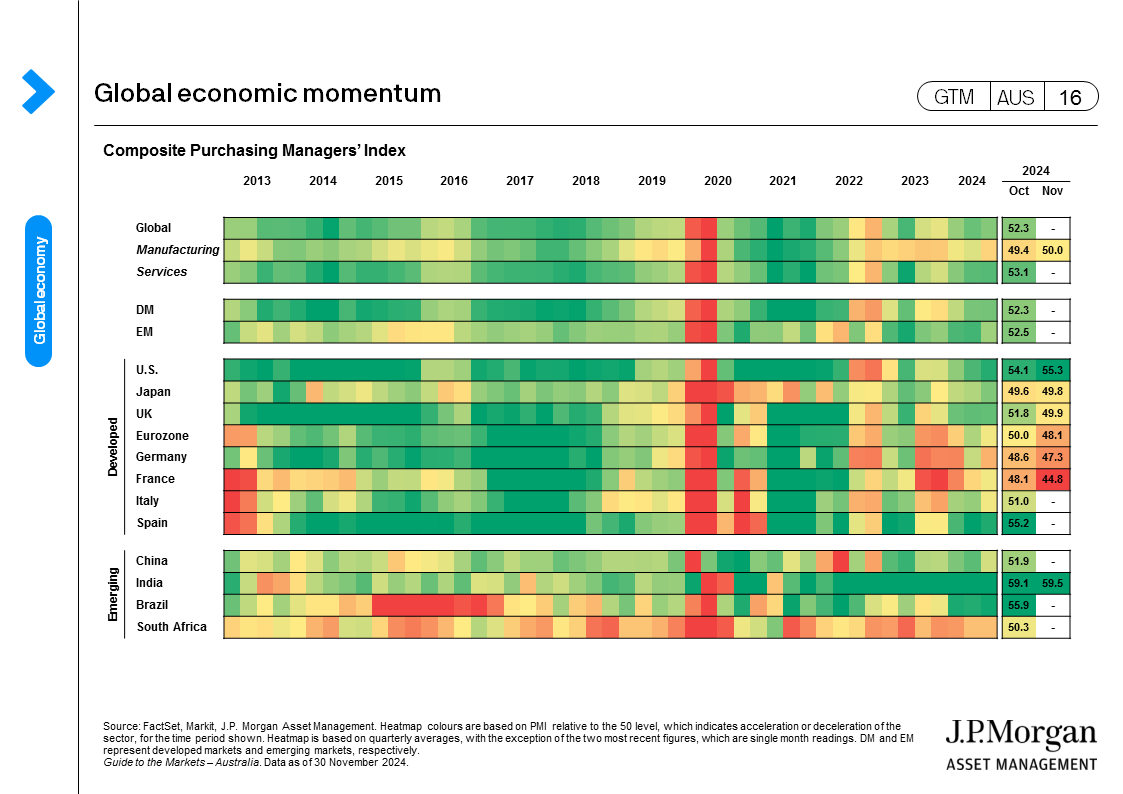
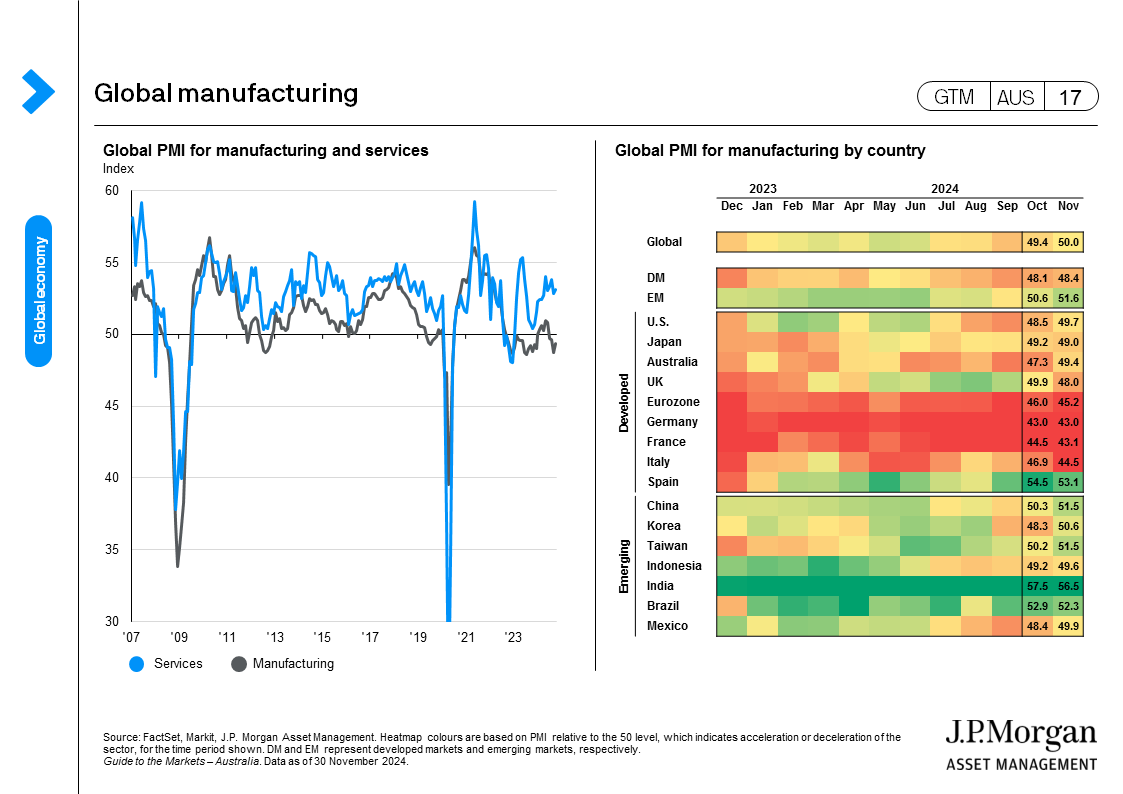
In Europe, more political uncertainties arose with the collapse of Germany’s ruling coalition and heightened tensions in reaching an agreement for France’s budget. Economic growth has remained weak, with the latest purchasing managers’ index (PMI) data showing a contracting private sector activity in the eurozone, while the region is facing increasing concerns from a potential trade war, weak demand from China and geopolitical risks. Aside from cheap valuations, easier monetary policies ahead as market pricings are hinting at the potential for the European Central Bank to even cut 50 bps in December, and a larger services sector in the UK economy, to shelter from potential U.S. tariffs, all pose a case for investors seeking to diversify their portfolios from an increasingly concentrated capital market.
Australian economy:
- The Reserve Bank of Australia (RBA) kept the cash rate on hold at 4.35% at the November meeting, in line with consensus expectations. The RBA pushed back that a within-range headline inflation would suffice for starting a rate cutting cycle, and its forecasts also hint at a longer time needed for inflation to be sustainably in the target range. The minutes of the November meeting retained its hawkish stance. Meanwhile, Governor Bullock reaffirmed that policy is currently restrictive enough and will remain so until the RBA sees a downward trajectory in domestic demand at a panel discussion later in the month.
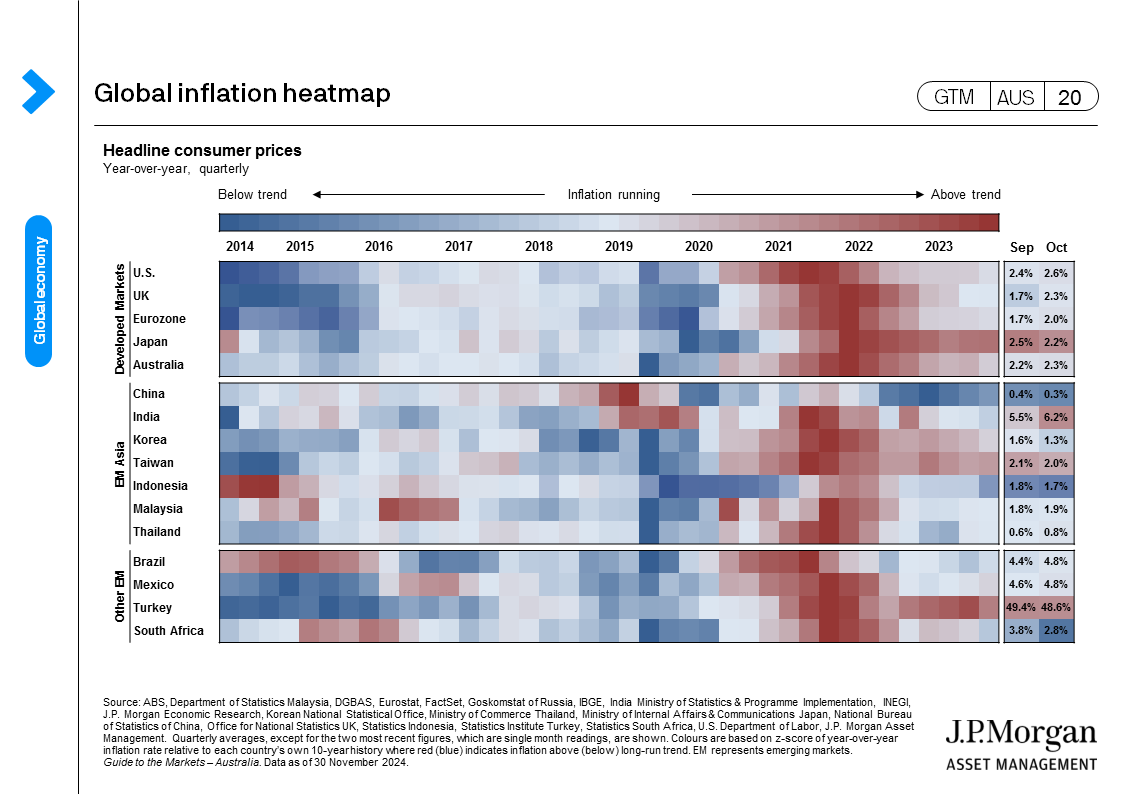
- The monthly consumer price index (CPI) was unchanged at 2.1% year-over-year (y/y) in October, but a touch softer than consensus expectation. Headline inflation was again distorted by the government’s energy subsidies effective since July as well as the government’s rental assistance, as the trimmed mean (core) inflation rate rose to 3.5% y/y.
(GTM AUS page 5) - Wages rose by only 3.5% y/y, the softest pace in two-years, according to the quarterly wage price index. The labour market remains tight, and the unemployment rate stayed at 4.1% in October. This echoes with the RBA’s call that labour market loosening has stalled. That said, employment growth was a touch softer, mainly reflecting weaker labour supply as participation rate edged down to 67.1%.
(GTM AUS page 9) - The consumer sentiment index rose to 94.6 points in November, the highest level over two years but still below the 100 points mark. Major improvements were noted in components such as family finances as concerns over further interest rate hikes fade and confidence in the economic outlook increases.
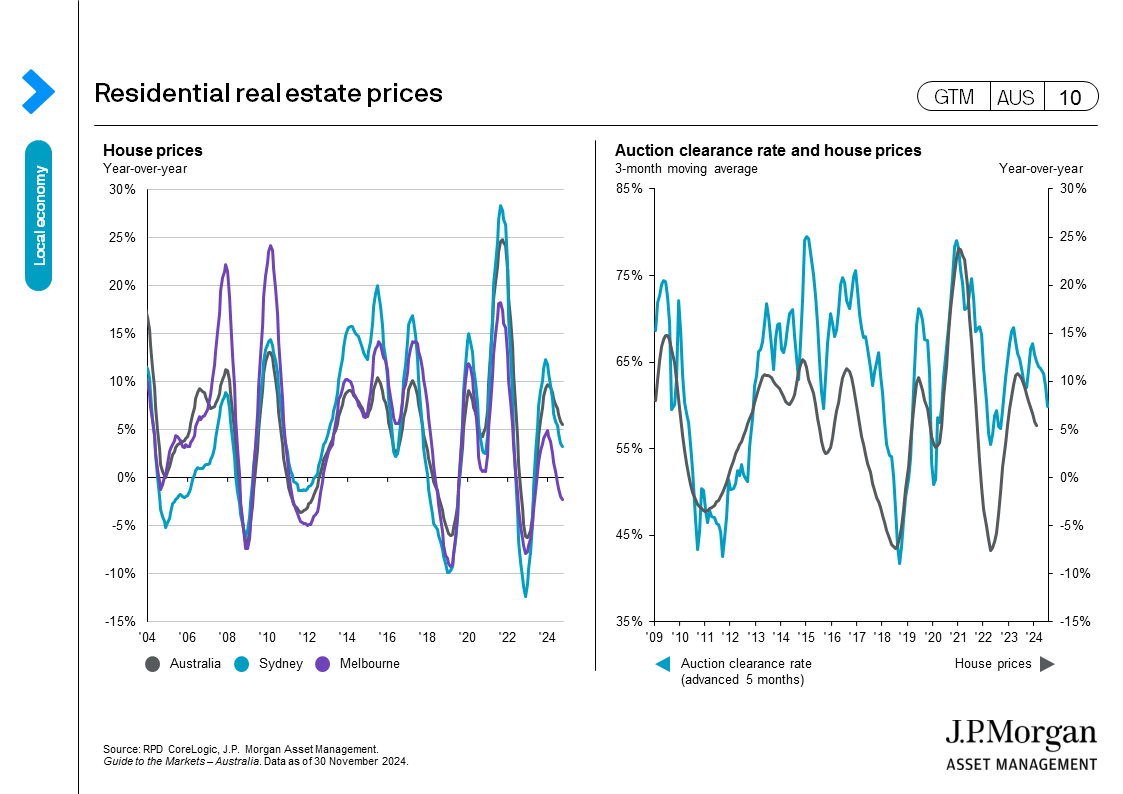
(GTM AUS page 6) - Housing prices continued to slow down in November, with the national index falling to to 5.5% y/y, while prices in Sydney slowed to 3.2% y/y and prices in Melbourne extended falls to -2.3% y/y.
(GTM AUS page 10)
Equities:
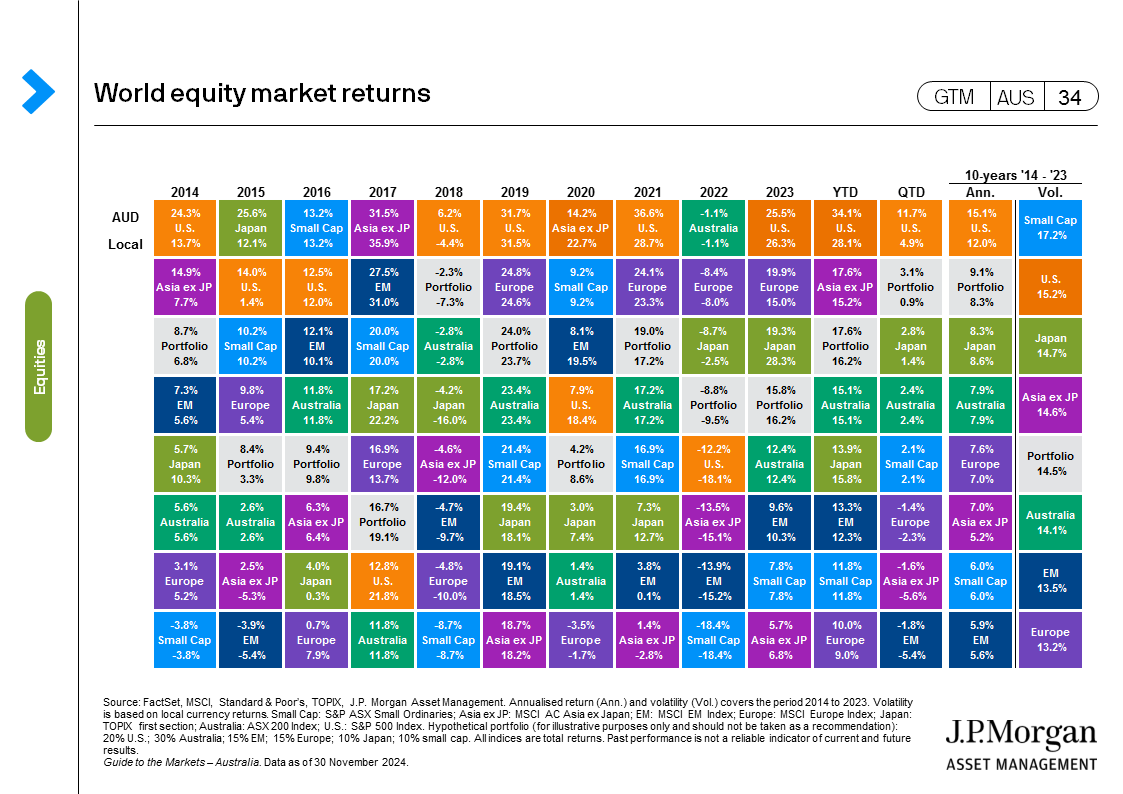
- The ASX 200 gained 3.4% over November while U.S. equities surged 5.7%, driven by election uncertainties dissipating and prospects of market-friendly Republican policies. Elsewhere, European equities edged up 0.3% while Japanese equities fell 0.6%.
- Emerging markets dropped 2.8%, dragged by weak performance in MSCI China which fell 4%, mainly due to tariff risks from a Trump administration as well as disappointing policy outcomes from Chinese officials.
(GTM AUS page 34) - Most of the ASX 200 sectors delivered positive returns, led by technology (+10.4%), consumer discretionary (+6.7%) and financials (+5.9%). Materials was the worst performing sector, returning 2.7% over the month.
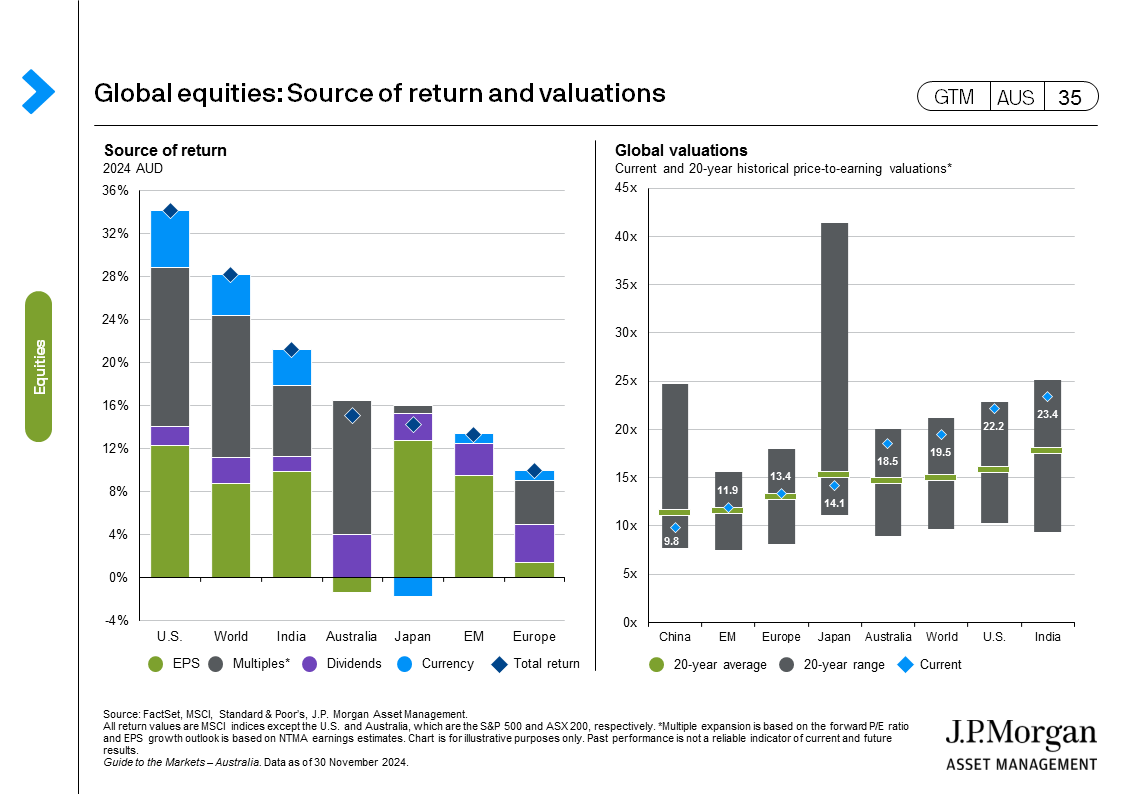
- Valuations rose over the month, with the ASX 200 and the U.S. S&P 500 reaching 18.5x and 22.2x forward price-to-earnings (P/E) ratio, respectively, while valuations are cheaper on the MSCI Europe and Japan TOPIX at 13.4x and 13.7x, respectively.
(GTM AUS page 35)
Fixed income:
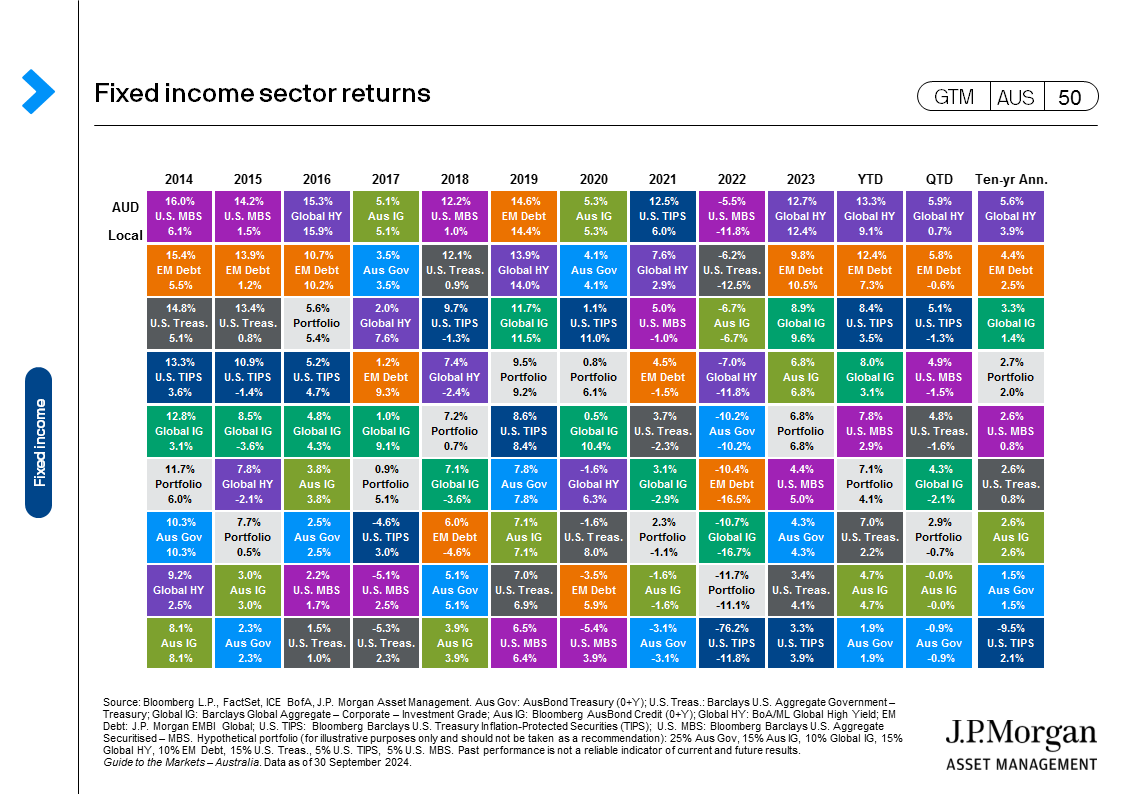
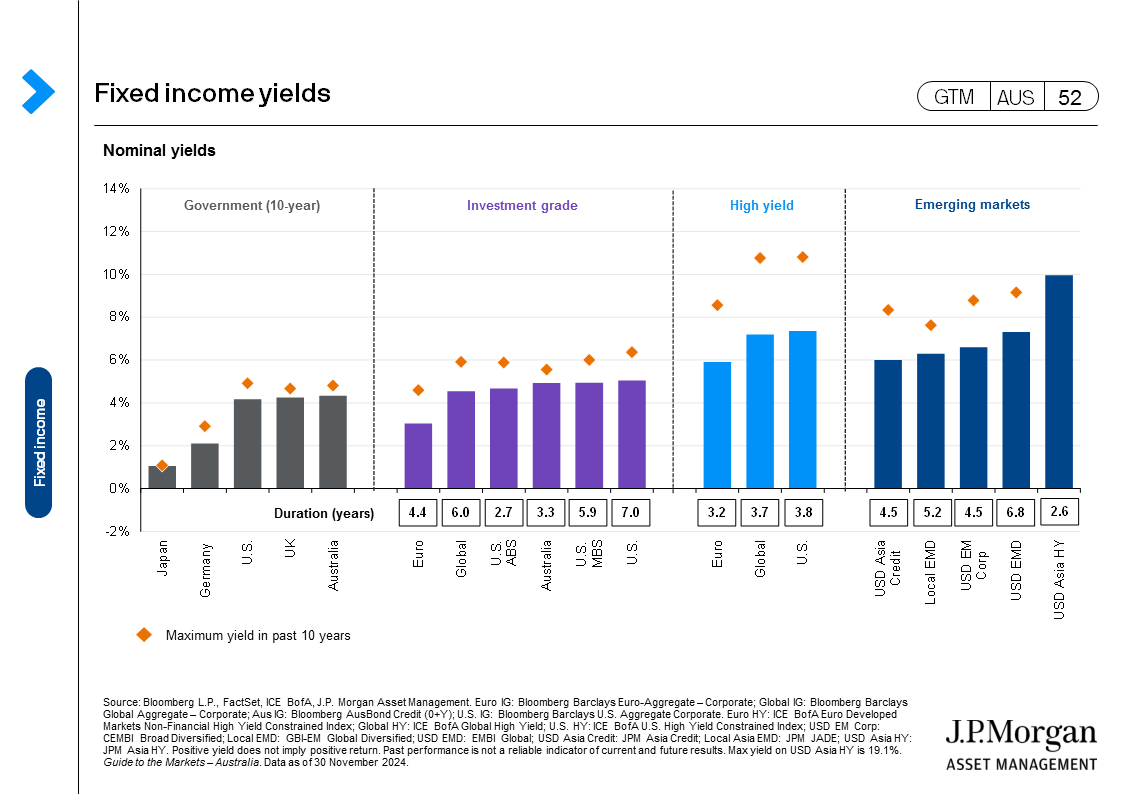
- Australian government bond yields edged down over the month, with 10-year yields retreating 16 bps to 4.34%. U.S. 10-year treasury yields were also lower by 11 bps, although the curve flattened with 2-year yields only 1 bps lower.
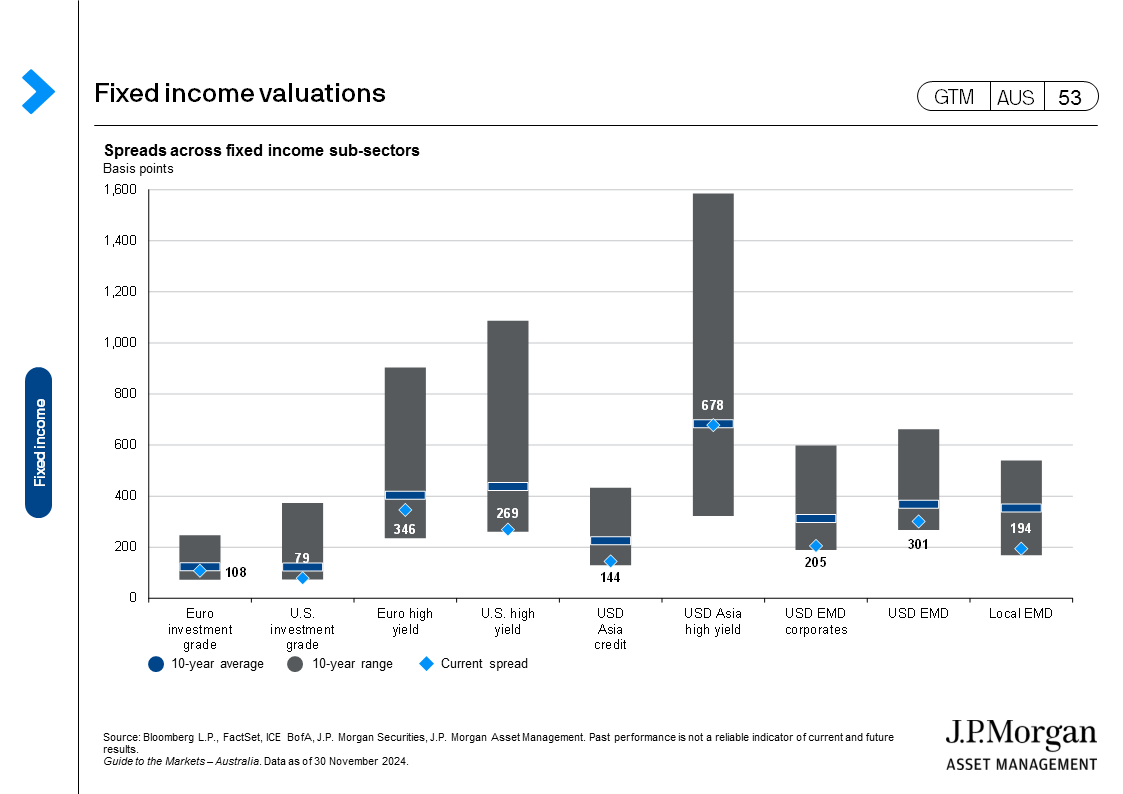
(GTM AUS page 50) - The credit market benefited on the back of expected pro-market policy proposals of the incoming U.S. government, with spreads on both U.S. investment grades and high yields narrowing and returning 1.3% and 1.2%, respectively.
(GTM AUS page 53)
Other assets:
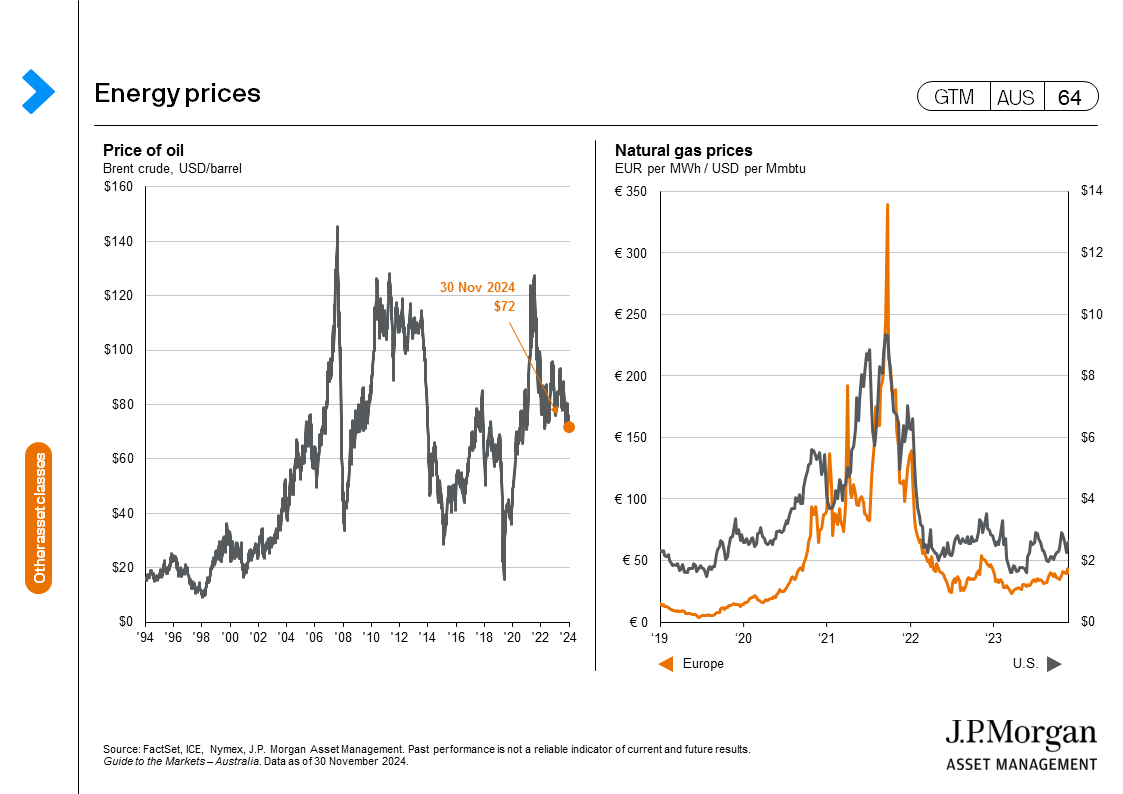
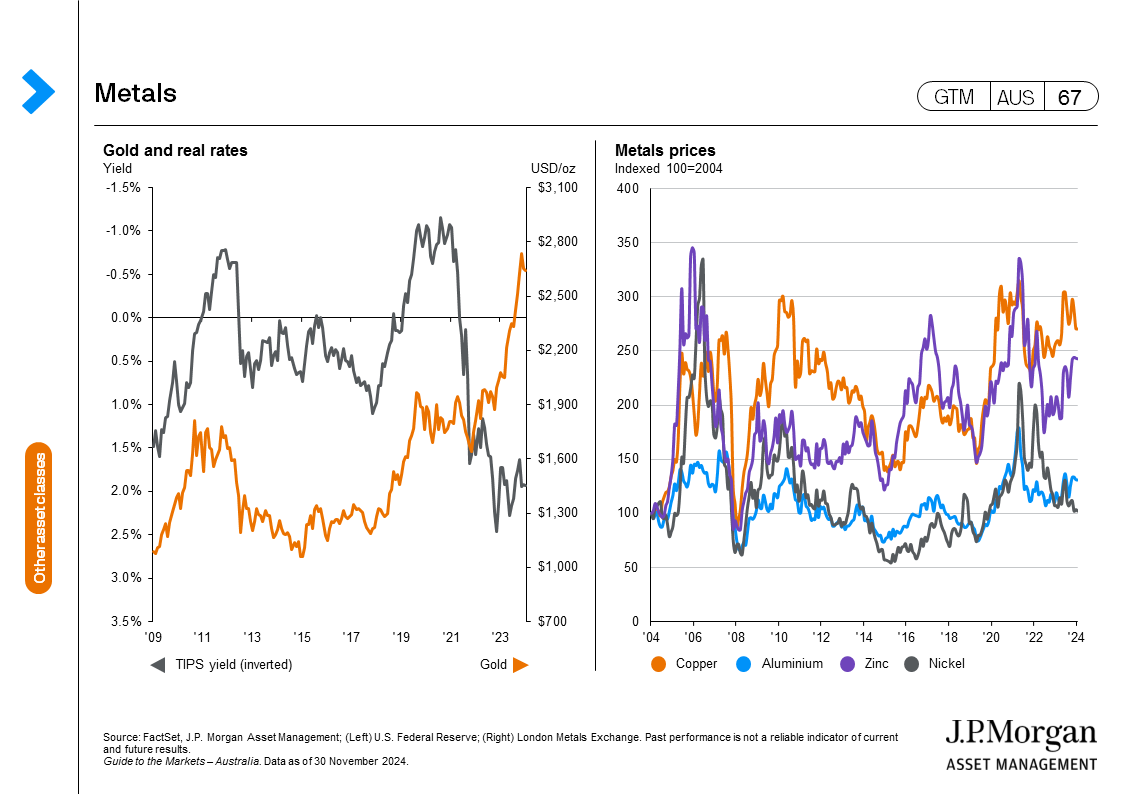
- The Bloomberg Commodities Index fell -0.7% over the month. Brent crude ended the month 2.7% higher. Apart from geopolitical factors, OPEC+ was reportedly considering delaying a planned increase in oil output due to ongoing weak demand in Asia, putting upward pressure on oil prices. Gold fell -4.6%, with less demand for safe haven assets after the nomination of Scott Bessent as Treasury Secretary and the de-escalation of geopolitical tensions in the Middle East.
(GTM AUS page 65, 67) - The USD extended further gains, as the proposed tariff plans will likely support the USD over the medium term by narrowing the U.S.’ trade deficit and potentially leading to a more hawkish Fed policy. The DXY was 1.7% higher over the month, with most of the major currencies weaker against the strong USD (EUR +2.8%, GBP +1.1%, CHF +1.9%, AUD +0.5%). The Japanese yen was an exception, strengthening 1.4% as the likelihood for a December hike by the Bank of Japan increases.
(GTM AUS page 69)
 |
0903c02a82674e7f


