![]()
The 3% difference: What leads to higher retirement savings rates?
06/03/2020
Katherine Roy
Lori Lucas
Jack VanDerhei
Kelly Hahn
Je Oh
Livia Salonen
In Brief
- Groundbreaking research from a collaboration of the Employee Benefit Research Institute and J.P. Morgan Asset Management is the first to use a unique set of data on actual spending and savings behavior to provide a holistic financial view of U.S. households.
- In our inaugural research, we ask: Why do some people save more than others, even when they have equivalent income? Despite having similar salaries, the middle 50% of our research populationA save about 3% more of their salary at all ages than the bottom 25% of savers. This 3% difference in savings behavior, if sustained over time, could ultimately explain some of the meaningful gap between the current retirement plan account balances of middle and low savers.
- For the very first time, we can point to the specific categories of current spending that appear to be constraining the ability to save more. Low savers generally spend more than middle savers as a percent of salary on housing, transportation and food and beverage, and less on travel. In future research, we will explore what factors might drive the increased spending.
- Defined contribution plans appear to be most households’ primary retirement savings vehicle, underscoring the importance of the employers’ role in savings.
OVERVIEW
It’s a difficult time in many ways. All of us are naturally focused on the near term, managing, as best we can, the profound disruptions caused by the COVID-19 shock to our lives at work and at home. With unemployment surging to alarming levels, the economic outlook remains uncertain. Many people, faced with financial hardship, may have no choice but to draw on their retirement savings for their immediate cash needs. But eventually the crisis will pass, and a long-term perspective on retirement must take into account both the arduous present and a more promising future.
That perspective, though, should be informed by a complete understanding of household behaviors through good times and bad—not just within but outside employer-sponsored plans, including debt, spending choices and other savings and investments. For example, defined contribution (DC) plan features such as automatic enrollment, automatic contribution escalation and target date funds have been shown to be beneficial for DC plans and their participants. But skeptics may ask if these features have definitively improved retirement outcomes when a household’s complete picture is taken into consideration. Armed with insights into plan participants’ financial picture, plan sponsors can make more-informed choices about adjusting their plan design decisions, gaining confidence that they are targeted to improve retirement as well as overall financial outcomes.
Until now, policymakers, plan sponsors and plan providers have had to rely primarily on analysis of relatively limited survey-based data to better understand these household dynamics. While leading academic research has taken the first steps toward understanding how plan features may affect broader household finances,1 a comprehensive, large-scale view of household behavior has proved elusive.
For the first time, groundbreaking research from a collaboration of the Employee Benefit Research Institute (EBRI) and J.P. Morgan Asset Management (JPMAM) draws on a unique set of data tracking actual spending and savings behaviors to lift those data limitations.
Joining an EBRI/Investment Company Institute database of 27 million 401(k) participants to JPMorgan Chase & Co.’s database of 22 million consumers,2 we seek a more holistic understanding of the critical issues in retirement and financial wellness by factoring in both the household balance sheet and cash flow behaviors. We believe the data can better inform decisions in policymaking, plan design and retirement investment—and help solve some persistent mysteries around Americans’ savings patterns.
We first tackle the conundrum of why some people save more than others, even when they have an equivalent salary. What spending behaviors do higher savers engage in that allow them to save more for retirement at all ages and accumulate considerably more over the long term? What might be inhibiting low savers from increasing their retirement plan contributions? Our analysis revealed that DC plans are likely to be most households’ primary retirement savings vehicle,3 underscoring the importance of the employers’ role in savings.
Past research has offered tentative explanations of savings disparities, including an inability to save due to:
- Low income making it harder to save enough for retirement
- Prioritization of current spending needs over savings (also known as hyperbolic discounting)
- Challenges in navigating the defined contribution system specifically and the overall savings system generally
In this paper, we focus on the first two themes. Among the highlights of our research findings:
- Despite having similar salaries, the middle 50% of our research population (based on employee contribution rate by age cohort) save about 3% more of their salary at all ages than the bottom 25% of savers.
- This 3% difference in savings behavior, if sustained over time, could ultimately explain the fact that the current retirement plan account balances of high tenured middle savers are almost two times larger than those of high tenured low savers.
- For the first time, we can point to the specific categories of current spending that are constraining the ability to save more. Low savers across most age groups spend more as a percent of salary on housing, transportation and food and beverage, and less on travel. All the other categories we looked at are similar across age cohorts.
METHODOLOGY: INSIDE THE EBRI/ICI-JPMORGAN CHASE DATA
First, a brief explanation of our methodology.
Using 2016 data, we compare information about 22 million Chase households and the records for 27 million 401(k) plan participants to isolate an overlapping population of 1.4 million households. We remove households with:
- de minimis employer plan balances4
- total spending less than 50% of salary
- likely more than one earner5
Examining the resulting population of 10,000 households, we look at behaviors by age cohort and try to find the links among salary, employee savings, spending and 401(k) balance. Any employer match is not included in our analysis.
We note two caveats. First, our research is a snapshot in time; we examine individual households’ concurrent financial picture instead of their behavioral trends over the years. Second, we use fairly broad definitions of spending categories. For example, the food and beverage category does not distinguish among spending subcategories such as eating at restaurants vs. eating at home. More granular analysis of the data will inform future reports.
SAVER PROFILES BY AGE COHORTS
What defines a high, middle or low saver? Using observed savings behaviors by age, we divide our population into three groups, based on their 401(k) contributions as a percent of salary by age cohort. We define middle savers as the middle 50% of our population, high savers as the top 25% and low savers as the bottom 25%, based on the employee contribution rate by age cohort (EXHIBIT 1).
Low savers
At most ages, they save about 2% of their salary, slowly raising the amount to 3% as they approach retirement.
Middle savers
At younger ages, they save about 5% of their salary, slowly raising the amount to about 6% as they approach retirement.
High savers
At younger ages, they save about 9% of their salary, and they continue to increase their contribution as they get older. Notably, high savers save about twice as much as the middle savers throughout all age cohorts.
How should we think about the difference in the contribution rates of the three groups of savers, especially the gap between middle and low savers?
Middle savers save about 3% more of their salary at all ages than low savers
EXHIBIT 1: MEDIAN CONTRIBUTION RATE AS A PERCENT OF SALARY
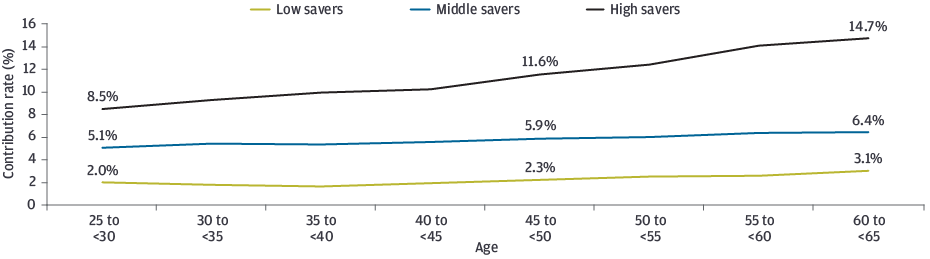
Source: 2016 anonymized EBRI, EBRI/ICI Participant-Directed Retirement Plan Data Collection and JPMorgan Chase data. A population of 22 million Chase households and 27 million 401(k) plan participant records were isolated to identify an overlapping population of 1.4 million households. Households with employer plan balances of $100 or less, total spending less than 50% of salary or likelihood of more than one earner were removed to ensure a complete picture of saving/spending.
EXHIBIT 2 shows the median account balances as a multiple of the current salary of high tenured savers (defined as the top third of the overlap population by tenure and age cohort). The high savers peak at 401(k) balances that are more than four times their current salary by age 60, whereas low savers reach one times their salary and middle savers reach about two times. This approach aims to normalize for salary differences so that we can make fair comparisons among participants. Middle savers have higher median account balances at all ages than low savers, with balances more than double those of low savers at ages 55–65. The median account balances of high savers are four times those of low savers by age 60.
Low savers only reach 1x their salary by age 60
EXHIBIT 2: MEDIAN 401(K) BALANCE WITH CURRENT EMPLOYER FOR HIGH TENURED* SAVERS AS A MULTIPLE OF SALARY
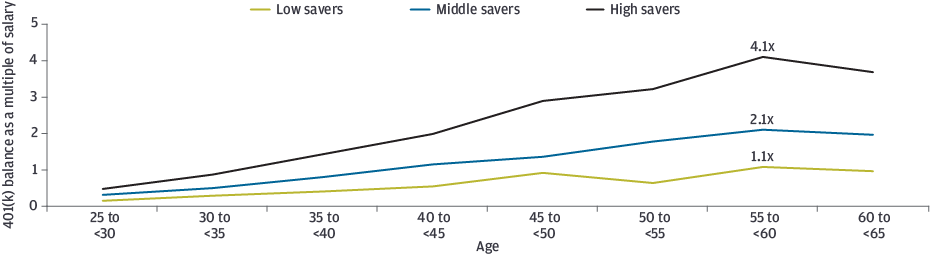
 Source: 2016 anonymized EBRI, EBRI/ICI Participant-Directed Retirement Plan Data Collection and JPMorgan Chase data. A population of 22 million Chase households and 27 million 401(k) plan participant records were isolated to identify an overlapping population of 1.4 million households. Households with employer plan balances of $100 or less, total spending less than 50% of salary or likelihood of more than one earner were removed to ensure a complete picture of saving/spending.
*High tenured individuals are defined as those in the top one-third highest tenure (at their current employer) by age.
Turning to the salary component for middle and low savers, we wondered if middle savers might generally have better-paying jobs. But when we look at salary data, we find only a very modest difference between the two groups (EXHIBIT 3). At age 50, both middle and low savers earn about $50,000 a year.
There is a very modest salary difference between low and middle savers
EXHIBIT 3: MEDIAN SALARY BY SAVER TYPE**
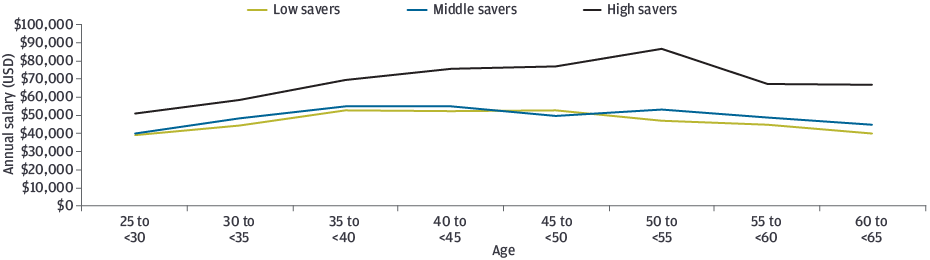
Source: 2016 anonymized EBRI, EBRI/ICI Participant-Directed Retirement Plan Data Collection and JPMorgan Chase data. A population of 22 million Chase households and 27 million 401(k) plan participant records were isolated to identify an overlapping population of 1.4 million households. Households with employer plan balances of $100 or less, total spending less than 50% of salary or likelihood of more than one earner were removed to ensure a complete picture of saving/spending.
**Decline in high savers at 55+ may be the result of high earners leaving the workforce, resulting in lower median income for the cohorts.
HOW SMALL DIFFERENCES IN SPENDING CAN HAVE A BIG IMPACT ON SAVING
So what accounts for the considerable gap between the median account balances of middle and low savers? Meaningful differences in spending behavior may well be the answer, as the EBRI-J.P. Morgan Asset Management analysis reveals.
EXHIBIT 4 shows spending as a percent of salary for low and middle savers. It demonstrates that low savers spend about 2% to 3% more of their salary when compared with middle savers, especially at younger age cohorts.
Low savers spend about 2% to 3% more of their salary than middle savers up to age 45
EXHIBIT 4: TOTAL SPENDING COMPARISON FOR LOW AND MIDDLE SAVERS
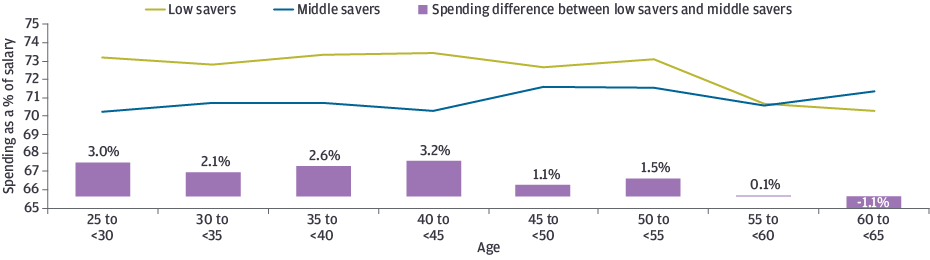
Source: 2016 anonymized EBRI, EBRI/ICI Participant-Directed Retirement Plan Data Collection and JPMorgan Chase data. A population of 22 million Chase households and 27 million 401(k) plan participant records were isolated to identify an overlapping population of 1.4 million households. Households with employer plan balances of $100 or less, total spending less than 50% of salary or likelihood of more than one earner were removed to ensure a complete picture of saving/ spending. Select Chase credit card, debit card (excluding some co-branded cards), electronic payment, ATM withdrawal and check transactions from January 1 to December 31, 2016. Outliers in each asset group were excluded (0.1% of top spenders in each spending category). Information that would have allowed identification of specific customers was removed prior to the analysis.
We asked ourselves what might explain the saving and spending disparities between low and middle savers. Do the low savers have more money to spend after payroll deductions? Are the middle savers saving outside their 401(k) plans? Using median salaries, we estimated payroll deductions (federal, state and local taxes, and health insurance premiums) by age cohorts; when these deductions were combined with observed spending and 401(k) contributions, there was likely no money left unaccounted for. This suggests that the 401(k) is the primary vehicle that participants use to save for retirement.
As a result, we feel confident in concluding that the difference in spending between low and middle savers explains the lion’s share of the gap between their respective saving rates.
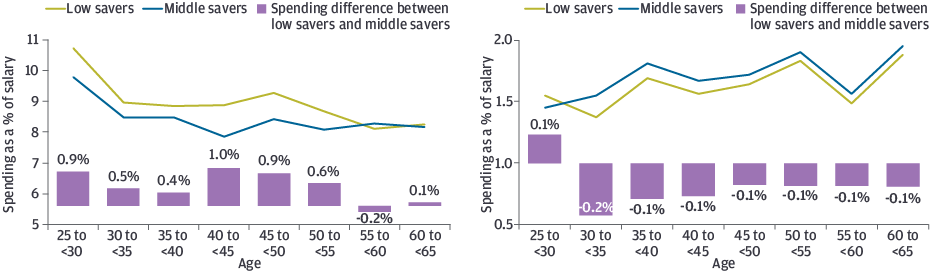
Which specific spending categories do low savers spend more on as a percent of salary than the middle savers? Our research identifies three categories: housing,6 transportation7 and food and beverage8 (EXHIBIT 5). Specifically:
- Housing costs for low savers are not consistently higher than for middle savers across the age cohorts, but at times the higher cost was notable. For example, while middle savers spend 16% of their salary on housing at age 25, low savers spend nearly 18%. Between ages 40 and 45, the housing category alone is a third of the contribution rate gap between middle and low savers.
- Spending on transportation as a percent of salary is higher for low savers than middle savers across the age spectrum until around age 55, averaging about 0.7% more between ages 25 and 55.
- Spending on food and beverage as a percent of salary is around 0.4% more for low savers than middle savers across all age cohorts.
- As a percent of salary, low savers do spend less on travel, but the difference is a fraction of a percent less than middle savers.9
- Other expenditure categories, such as education and apparel, are very similar between low and middle savers.
Low savers spend more on housing, transportation, food and beverage—and less on travel
EXHIBIT 5A: MEDIAN FOOD AND BEVERAGE AS A PERCENT OF SALARY
EXHIBIT 5B: MEDIAN HOUSING AS A PERCENT OF SALARY
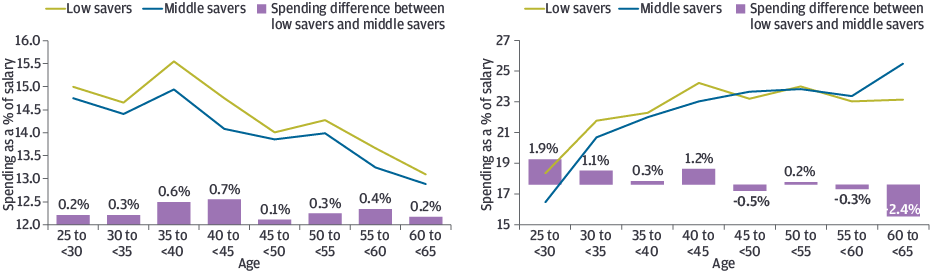
EXHIBIT 5C: MEDIAN TRANSPORTATION AS A PERCENT OF SALARY
EXHIBIT 5D: MEDIAN TRAVEL AS A PERCENT OF SALARY
Source: 2016 anonymized EBRI, EBRI/ICI Participant-Directed Retirement Plan Data Collection and JPMorgan Chase data. A population of 22 million Chase households and 27 million 401(k) plan participant records were isolated to identify an overlapping population of 1.4 million households. Households with employer plan balances of $100 or less, total spending less than 50% of salary or likelihood of more than one earner were removed to ensure a complete picture of saving/spending. Select Chase credit card, debit card (excluding some co-branded cards), electronic payment, ATM withdrawal and check transactions from January 1 to December 31, 2016. Outliers in each asset group were excluded (0.1% of top spenders in each spending category). Information that would have allowed identification of specific customers was removed prior to the analysis.
FINAL THOUGHTS
We believe that our research findings will be enlightening and useful for policymakers, employers and plan providers. Returning to the commonly held views of the causes of lower savings, we make a few observations.
We find that low salary does not appear to lead to lower savings rates at the median, as low and middle savers have approximately the same levels of salary at the median level.
As to the prioritization of current spending needs over savings, for the first time we can point to the specific categories of current spending that may be constraining the ability to save more.
As employers and others seek to help low savers to save more, it remains unclear how adjustable that spending may be. Essentially, is higher spending due to:
- being employed in higher cost-of-living areas, living farther from work for more affordable housing but as a result facing higher transportation costs, buying more food to feed bigger families—OR
- choosing to frequently eat out and buy more expensive cars or the latest home technology
The answer may be somewhere in between, but the good news is we have the data to dig deeper.
In future research, we will explore what factors might influence the increased spending on housing, transportation, food and beverage, and examine how dual-earner households might differ from single-earner households. We will also aim to follow people through time longitudinally and not just take a snapshot in time. We think our research can provide useful insights for those seeking to understand savings behavior, both inside and outside the defined contribution system.
Separately, EBRI will publish an Issue Brief documenting the results of this research in greater detail. In coming months, new content from J.P. Morgan Asset Management will examine how our new research can inform plan design and communication, financial wellness programs, workforce management and retirement plan investment.
Both EBRI and J.P. Morgan Asset Management believe that much can be done, by policymakers, plan sponsors and plan providers, to facilitate better retirement outcomes. We hope our important new research collaboration, the first to use a unique set of data on actual spending and savings behavior, will be the start of many fruitful conversations.
A Based on employee contribution rates by age cohort.
1 “Borrowing to Save? The Impact of Automatic Enrollment on Debt.” John Beshears, James J. Choi, David Laibson, Brigitte C. Madrian and William L. Skimmyhorn. NBER Working Paper No. 25876 (May 2019, revised July 2019).
2 Since 1996, EBRI, with more than 40 years of research on trends in employee benefits, has collaborated with the Investment Company Institute (ICI) in the collection of data on roughly 27 million participants in 401(k) plans. Data from JPMorgan Chase, which serves nearly half of all U.S. households, draws on all payment mechanisms (select credit and debit cards, electronic transfers, cash and checking) to form a comprehensive picture of total household spending for around 22 million customer households. Data privacy of customers and contractual relationships with recordkeepers have been carefully protected, and EBRI/ICI data was not transferred to JPMorgan Chase. EBRI has no access to personally identifiable information. While this paper uses data from the EBRI/ICI database, ICI did not participate in the research collaboration between EBRI and J.P. Morgan Asset Management and was not involved in the writing of this paper.
3 A discussion of defined benefit plans is beyond the scope of this paper.
4 De minimis is defined as an account balance with $100 or less, most likely the result of an inactive participant.
5 The initial matching was based on the primary household member only and did not include other members in the household who may receive income, contribute to spending and may or may not have access to an employer plan. For this reason, this analysis is limited to single-earning households only.
6 Housing includes everything related to owning and maintaining a home. Examples of spending within the housing category would include mortgage, mortgage interest, rent, repairs and remodeling, maintenance, utilities, furnishings and appliances.
7 Transportation examples are vehicle purchase or leases, licensing and registration, gas, maintenance, public transportation and taxis.
8 Food and beverage typically refers to food and alcohol spending both in and out of the home.
9 Travel examples are airline tickets, hotels and rental cars.
0903c02a828e89e1
Disclosures
This research paper was produced through a collaboration between J.P. Morgan Asset Management and the Employee Benefit Research Institute (EBRI), a Washington, D.C.-based organization committed exclusively to public policy research and education on economic security and employee benefit issues.
In an ongoing collaborative effort, the Employee Benefit Research Institute (EBRI) and the Investment Company Institute (ICI) maintain the EBRI/ICI Participant-Directed Retirement Plan Data Collection Project, which is the largest, most representative repository of information about individual 401(k) plan participant accounts. ICI is the leading association representing regulated funds globally, including mutual funds, exchange-traded funds (ETFs), closed-end funds, and unit investment trusts (UITs) in the United States, and similar funds offered to investors in jurisdictions worldwide. While this paper uses data from the EBRI/ICI database, ICI did not participate in the research collaboration between EBRI and J.P. Morgan Asset Management and was not involved in the writing of this paper.
EBRI is not affiliated with JPMorgan Chase & Co. or any of its affiliates or subsidiaries.
DATA PRIVACY: We have a number of security protocols in place which are designed to ensure all customer data are kept confidential and secure. We use reasonable physical, electronic and procedural safeguards that are designed to comply with federal standards to protect and limit access to personal information. There are several key controls and policies in place which are designed to ensure customer data are safe, secure and anonymous: (1) Before J.P. Morgan Asset Management (JPMAM) receives the data, all selected data is highly aggregated and all unique identifiable information, including names, account numbers, addresses, dates of birth and Social Security numbers, is removed. (2) JPMAM has put privacy protocols for its researchers in place. Researchers are obligated to use the data solely for approved research and are obligated not to re-identify any individual represented in the data. (3) JPMAM does not allow the publication of any information about an individual or entity. Any data point included in any publication based on customer data may only reflect aggregate information. (4) The data are stored on a secure server and can be accessed only under strict security procedures. Researchers are not permitted to export the data outside of JPMorgan Chase’s (JPMC) systems. The system complies with all JPMC Information Technology Risk Management requirements for the monitoring and security of data. (5) JPMAM provides valuable insights to policymakers, businesses and financial professionals, but these insights cannot come at the expense of consumer privacy. We take every precaution to ensure the confidence and security of our account holders’ private information.