You are about to leave the site Close
J.P. Morgan Asset Management’s website and/or mobile terms, privacy and security policies don't apply to the site or app you're about to visit. Please review its terms, privacy and security policies to see how they apply to you. J.P. Morgan Asset Management isn’t responsible for (and doesn't provide) any products, services or content at this third-party site or app, except for products and services that explicitly carry the J.P. Morgan Asset Management name.
CONTINUE Go Back

<p>2026 Midterm Election Hub</p>

Expert insights to provide perspective beyond the headlines, highlighting the key implications, opportunities and risks of the 2026 midterm elections and recent policy changes.

  1. Home | US Financial Professionals
  2. Insights
  • What does the current midterm election landscape look like?

  • How could redistricting impact the election outcome?

  • How might policy shift after the midterms?

  • How do Americans view Artificial Intelligence?

  • How should investors approach investing in an election year?

  • How do markets perform in midterm election years?

  • What configuration of government typically performs best?

What does the current midterm election landscape look like?

Currently, Republicans have a unified government – control of the White House and both chambers of Congress. However, their majority is slim, which means either they maintain narrow control, or cede one or both chambers of Congress to the Democrats.

The Senate currently consists of 45 Democrats, 53 Republicans and 2 Independents that caucus with the Democrats. The Democrats would need to gain 4 additional seats to take control of the Senate. While their open seats in Michigan and New Hampshire are considered a toss-up, six potential pick-ups would be most likely in North Carolina, Maine, Ohio, Texas, Iowa and Alaska.

The House of Representatives currently consists of 219 Republicans, 214 Democrats, and 2 vacant seats (one formerly held by a Republican in Texas and one formerly held by a Democrat in Florida). The Democrats would need maintain their vacancies and win 3 additional seats to take control of the House. One additional complication is congressional redistricting, which could favor the Republicans in Florida, Texas, North Carolina, Tennessee and Missouri, but favor Democrats in California and Utah. In total, this could net the Republicans 5-10 seats. Still, the Democrats are marginally favored to win the House.

While individual races and candidates are of course key determinants, two other factors are at play. One, midterms are often considered a referendum on the president, and the president’s approval rating has slumped to its lowest of his term thus far. Two, campaign funding has been much stronger for Republicans than Democrats, which can move the needle in select races. 

Votes or seats in the Senate and House of Representatives 
vote or seats_1

Source: 270towin, J.P. Morgan Asset Management. The Senate currently consists of 45 Democrats, 53 Republicans and 2 Independents that caucus with the Democrats. *Currently, the House of Representatives consists of 219 Republicans, 214 Democrats and 2 vacant seats (one formerly held by a Republican in Texas and one formerly held by a Democrat in Florida). “Current” includes vacant seats. Data are as of September 18, 2026.

How could redistricting impact the election outcome?

After the U.S. Census Bureau releases its population survey every 10 years, each state redraws its congressional district lines to reflect changes in population. Because congressional representation in the House of Representatives is determined by these congressional districts, parties may attempt to draw the maps to favor their party.

This cycle, redistricting has been particularly active following the Supreme Court reversing prior rulings that protected the collective voting power of racial minorities in congressional maps under the 1965 Voting Rights Act.

Thus far, redistricting could yield solid flips in favor of the Republicans in Texas, Missouri, Louisiana, Alabama, and Tennessee to the tune of about 4 seats. New maps are also likely to favor Republican candidates in North Carolina and Florida for another 5 seats; however, those races could be much closer and redistricting doesn’t guarantee Republican victories in those seats. On the other hand, Democrats could net 3-5 seats in California and 1 in Utah. Democrats were also expected to potentially gain 4 seats in Virginia until the Supreme Court of Virginia struck down their map, potentially protecting some seats for Republicans. In Ohio, Republicans and Democrats struck a deal on district lines, which on balance may not clearly favor one party or another. 

While redistricting is just one piece of the puzzle for some of these seats since many are competitive notwithstanding, redistricting as a whole is expected to net the Republicans 5-10 additional seats. Still, the Democrats had a decent chance of flipping 10-20 seats in the House in their favor, so while that margin narrows with redistricting, it should still be enough to surpass the 3 seats the Democrats need to flip in order to take control of the House.
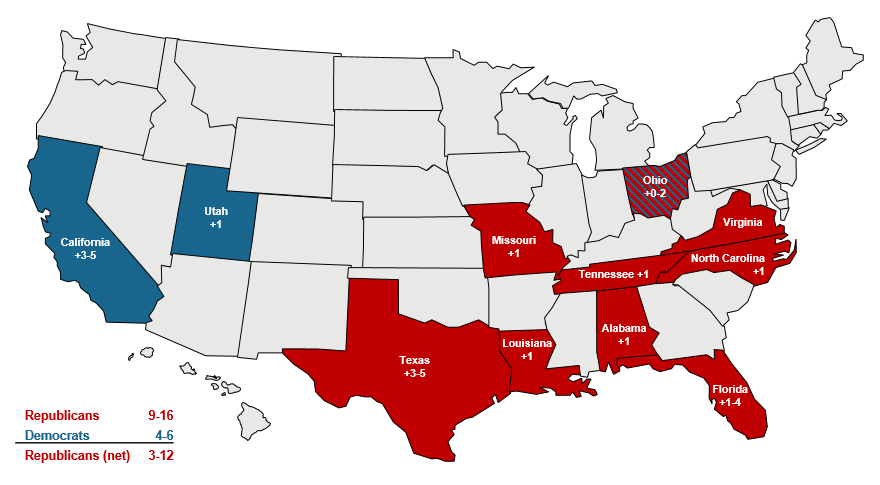
Potential impacts of redistricting on seats gained by party in the House
redistricting_3
Source: 270towin, The Cook Political Report, University of Virginia’s Sabato’s Crystal Ball. J.P. Morgan Asset Management. Data are as of September 18, 2026.

How might policy shift after the midterms?

The first two years of a president’s term are often a mad dash to check off as many campaign policy promises as possible. That is because often presidents have a unified government (control of Congress) after a general election, but Congressional control can often diminish or flip after the midterms, making it more difficult to achieve agenda items.

Below is an outlook for key policy items under continued Republican control vs. a divided Congress:

  • Debt and deficits: Debt and deficits are on the rise but could be more contained under either unified or divided government given the deficit expansion already underway so far this term.

    “Reconciliation 2.0”, a package that include $70 billion for immigration and border protection, passed in June 2026. In addition, Republicans are considering Reconciliation 3.0 to follow, a broader package that would focus on defense, housing and health care, including continuing to tackle fraud, to the tune of $350 billion. However, even with a unified Congress, this package faces an uphill battle.

    With a divided Congress, Democrats could extract limited concessions for some of their key health care or entitlement priorities, but the most significant implication of a divided Congress would be government shutdown risks in 2027 and beyond, and another debt ceiling standoff between late 2027 and early 2028.
  • Tariffs and trade: The Administration has established a new legal authorization for tariffs under Section 301. The U.S. is also engaging in negotiations for the USMCA (the U.S.-Mexico-Canada trade agreement). Although trade progress could be made before midterms, the President still wields significant executive authority on trade regardless of unified or divided government.
  • Foreign policy: As demonstrated with conflicts in Venezuela and Iran, the President also has significant, although not unlimited, authority on foreign policy matters. However, foreign intervention is at odds with the President’s stated “American First” policy, and has proved to be unpopular with his base, so the Administration could be reluctant to pursue new foreign entanglements.
  • Affordability: Although affordability was a key priority, it has faced setbacks given entrenched housing challenges, higher rates, the surge in gasoline prices and the resultant effects on inflation. Elevated tax refunds were anticipated to boost the consumer, but gas prices have neutralized that benefit for lower- and middle-income households. The Administration will continue to tackle this intractable problem, with some possible collaboration across party lines, but the prospects of additional stimulus look dimmer given stretched federal finances.
  • Appointees: If Democrats are successful in flipping both chambers of Congress, the additional complication for the Administration would be that Senate Democrats could slow or block political appointees to the Supreme Court, lower courts or the Federal Reserve. 

How do Americans view Artificial Intelligence?

Affordability and homeownership are among the key existential concerns Americans are grappling with, but recently a new one has entered the fray: artificial intelligence. From the data center- buildout to the threat to jobs, opinions on AI are evolving. In fact, in 2022, 38% of Americans were more concerned than excited about AI. That jumped to 50% in 2025.

As massive capex pours into data center construction, 71% of Americans oppose local construction of data centers in their area, according to Gallup. Interestingly, the reasons cited were environmental and quality-of-life related, with only one-fifth of respondents mentioning cost implications such as higher utilities. This contrasts with the 77% of respondents in a recent Reuters/Ipsos poll that are concerned about AI making electricity costs higher.

Anxieties grow as the buildout translates to greater AI proliferation, and productivity gains threaten jobs. About 64% of U.S. adults think AI will result in fewer jobs.

Still, despite 71% of Americans thinking AI will make their personal information less secure, 43% of U.S. adults say it is important for the U.S. to be the world’s leader in developing AI. This highlights the tensions between the risks and opportunities artificial intelligence presents at a national level, which is why balanced regulation becomes a key consideration.

Thus far, the approach has been “innovate first, regulate later” with much of the regulatory activity happening at the state and local level rather than federally. Republicans’ approach has been light regulation with a focus on global competitiveness and national security, while Democrats have focused on consumer safeguards, labor protection, privacy and misinformation.

Despite early efforts, U.S. lawmakers have a long way to go on regulation – not only when it comes to establishing a framework but also garnering public support. Ipsos conducted a poll last year across 31 countries, and the U.S. scored the lowest with just 31% of respondents trusting their own government to regulate AI responsibly. 

Americans are growing skeptical about the AI buildout
americans are growing_image
Source: Reuters/Ipsos, J.P. Morgan Asset Management. Survey of 4,531 adults on June 3-8, 2026. The margin of error is +/- 2 percentage points. Data from Pew Research polls unless otherwise noted.

How should investors approach investing in an election year?

Political opinions are best expressed at the polls, not in a portfolio. One cardinal rule for investors: Don’t let how you feel about politics overrule how you think about investing.

The chart below shows a survey from the Pew Research Center asking Americans to rate economic conditions. The results show that Republicans often feel better about the economy under a Republican president, while similarly Democrats feel better about the economy under a Democratic president. Investors often make portfolio decisions based on their economic outlook.

Yet, average annual returns on the S&P 500 during the Obama administration of 16.3% and during the first Trump administration of 16.0% were almost identical and higher than the average return over the last 30 years of 10.3%. It is likely that the macro conditions, like ultra-low interest rates enjoyed during both Obama and Trump administrations, were a more influential driver of above-average returns during those periods, rather than the policy prescriptions each president espoused. Even as macro conditions have shifted, returns during the Biden administration and the second Trump administration have also easily exceeded long-term averages, owing to the strength of American companies, the aggregate health of the consumer and technological innovation.

Investors who did allow their political opinions to overrule their investing discipline may have missed out on above-average returns during political administrations they didn’t like. 

Percentage of Republicans and Democrats who rate national economic conditions as excellent or good
dont let_3

Source: Pew Research Center, J.P. Morgan Asset Management. The survey was last conducted in February 2026. Pew Research Center asks the question: “Thinking about the nation’s economy, how would you rate economic conditions in this country today… as excellent, good, only fair or poor?” S&P 500 returns are average annualized total returns between presidential inauguration dates.
Guide to the Markets – U.S. Data are as of August 31, 2026. 

How do markets perform in midterm election years?

Elections are often a source of anxiety for investors because they introduce a new element of uncertainty to markets, which can result in lower returns and higher volatility. Since 1937, returns in midterm years were 9.2% on average vs. 13.3% in non-midterm years. Realized volatility was also higher.

However, simple averages don’t tell the full story. Midterm years have also coincided with particularly choppy years in the markets that have been entirely unrelated to the elections themselves. For example, 2018 and 2022 were both midterm years in which the stock market suffered negative returns. However, the pressure on the equity market came from the Federal Reserve hiking interest rates. Another notable negative midterm year: 2002, as the market bottomed out due to the tech wreck.

Still, markets may encounter some bumps along the way in midterm years, but those wrinkles tend to be smoothed out very quickly in the run-up to the election and thereafter regardless of the result. In fact, average returns were slightly negative in each of the three quarters preceding a midterm but then jumped an average of 6.6% in the fourth quarter.

If that’s the case, why not reduce equity exposure before the election and ratchet it back up once the polls close? History shows that markets begin to rally just under a month before election day, making timing the market a difficult task, and one that is clearly unrelated to the election result itself. 

Average returns in midterm vs. non-midterm years

S&P 500 total return, 1937-2025 

Average returns in midterm
Source: Standard & Poor’s, FactSet, J.P. Morgan Asset Management. Data are as of September 18, 2026.

What configuration of government typically performs best?

Investors always want to know how markets perform under different government configurations. Since 1937, markets returned 16.3% under unified Republican control, but 9.4% under a Republican president with a divided Congress.

While simple to compute, these returns tell investors very little about why markets performed the way they did and how markets are likely to perform in the future. Monetary policy, fiscal policy, economic growth, labor markets, corporate profits and valuations are much better indicators of future returns. Fiscal policy is driven by the government of course, but if we get some form of divided government, policy making has historically been much more constrained.

The economic context, not the political context, tends to be much more relevant to understanding historical market environments and returns. 

Annual stock market returns by political party control

S&P 500 total return, 1937-2025, (#) = occurrences

Annual stock market
Source: Factset, Standard & Poor’s, U.S. House of Representatives, U.S. Senate, White House, J.P. Morgan Asset Management. Data are as of September 18, 2026.

Key Policy Slides

Control of the senate..2
Source: 270towin, J.P. Morgan Asset Management. The Senate currently consists of 45 Democrats, 53 Republicans, and 2 Independents that caucus with the Democrats. *Currently, the House of Representatives consists of 219 Republicans, 212 Democrats, and 4 vacant seats (one formerly held by a Republican in Texas, three formerly held by Democrats in California, Florida, and Georgia). “Current” includes vacant seats. Data are as of August 12, 2026.
republicans would_1
Source: 270towin, The Cook Political Report, J.P. Morgan Asset Management. 35 Senate seats are up for election in 2026. The senate currently consists of 45 Democrats, 53 Republicans, and 2 Independents that caucus with the Democrats. Green represents Independent Senators. Characterizations (secure, likely/lean, toss-up) are from The Cook Political Report. Data are as of September 18, 2026.
history shows_1
Source: U.S. Senate, U.S. House of Representatives, J.P. Morgan Asset Management. 42 seats lost in 2018 includes vacant North Carolina seat that was subject to new election as results were not certified due to allegations of fraud. Seats needed for Democrats to control the House is based on total Republican and Democratic seats held currently, plus vacancies. Data are as of September 18, 2026.
midterms are_1
Source: Silver Bulletin by Nate Silver (Left), Federal Election Commission (Right), J.P. Morgan Asset Management. Receipts reflect cumulative contributions and awards made since Jan ’25. Disbursements account for all purchases and payments, while debt includes loans owed by the committee. Data are as of September 18, 2026.
policy implications_1
Source: J.P. Morgan Asset Management. Data are as of September 18, 2026.
tariff and trade_1

Source: U.S. Census Bureau, U.S. Department of Treasury, U.S. International Trade Commission, J.P. Morgan Asset Management.

For illustrative purposes only. The estimated weighted average statutory U.S. tariff rate includes all tariffs that are currently in effect, not announced. Imports for consumption: goods brought into a country for direct use or sale in the domestic market. *Figures are based on 2024 import levels and assume no change in demand due to tariff increases. Tariff revenue shown are figures from the Monthly Treasury Statement. Import figures included in the table are from the U.S. Census Bureau. Estimates, projections and other forward-looking statements are based upon current beliefs and expectations. They are for illustrative purposes only and serve as an indication of what may occur. Given the inherent uncertainties and risks associated with forecasts, projections or other forward-looking statements, actual events, results or performance may differ materially from those reflected or contemplated.

Guide to the Markets – U.S. Data are as of September 18, 2026.

inflation has_1

Source: BLS, FactSet, J.P. Morgan Asset Management.

Contributions mirror the BLS methodology on Table 7 of the CPI report. Values may not sum to headline CPI figures due to rounding and underlying calculations. “Shelter” includes owners’ equivalent rent, rent of primary residence and tenants’ and household insurance. “Food at home” includes alcoholic beverages. Headline and core PCE deflator inflation shown are based on seasonally adjusted data due to data availability. Official October 2025 data unavailable due to government shutdown and data shown are J.P. Morgan Asset Management estimates.

Guide to the Markets – U.S. Data are as of September 18, 2026.

markets are now_1

Source: Bloomberg, FactSet, Federal Reserve, J.P. Morgan Asset Management.

Market expectations are based off of USD Overnight Index Swaps. *Long-run projections are the rates of growth, unemployment and inflation to which a policymaker expects the economy to converge over the next five to six years in absence of further shocks and under appropriate monetary policy. Forecasts, projections and other forward-looking statements are based upon current beliefs and expectations. They are for illustrative purposes only and serve as an indication of what may occur. Given the inherent uncertainties and risks associated with forecasts, projections or other forward-looking statements, actual events, results or performance may differ materially from those reflected or contemplated.

Guide to the Markets – U.S. Data are as of September 18, 2026.

deficits are_1

Source: BEA, CBO, Treasury Department, J.P. Morgan Asset Management.

(Left) Numbers may not sum to 100% due to rounding. (Top and bottom right) Estimates are from the Congressional Budget Office (CBO) February 2026 An Update to the Budget Outlook: 2026 to 2036. “Other” spending includes, but is not limited to, health insurance subsidies, income security and federal civilian and military retirement. Years shown are fiscal years. Forecasts are not a reliable indicator of future performance. Forecasts, projections and other forward-looking statements are based upon current beliefs and expectations. They are for illustrative purposes only and serve as an indication of what may occur. Given the inherent uncertainties and risks associated with forecasts, projections or other forward-looking statements, actual events, results or performance may differ materially from those reflected or contemplated.

Guide to the Markets – U.S. Data are as of September 18, 2026.

money supply_1

Source: Board of Governors of the Federal Reserve System (U.S.), M2 (M2SL), and U.S. Bureau of Economic Analysis, Real Gross Domestic Product (GDPC1), retrieved from FRED®, Federal Reserve Bank of St. Louis.

M2 is monthly, seasonally adjusted and reported in billions of dollars. Real GDP is quarterly, seasonally adjusted at an annual rate and reported in billions of chained 2017 dollars. Values are aligned to the administration-end dates.

Data are as of September 18, 2026.

dont let_1

Source: Board of Governors of the Federal Reserve System (U.S.), M2 (M2SL), and U.S. Bureau of Economic Analysis, Real Gross Domestic Product (GDPC1), retrieved from FRED®, Federal Reserve Bank of St. Louis.

M2 is monthly, seasonally adjusted and reported in billions of dollars. Real GDP is quarterly, seasonally adjusted at an annual rate and reported in billions of chained 2017 dollars. Values are aligned to the administration-end dates.

Data are as of September 18, 2026.

Past performance..2
Source: Factset, Standard & Poor’s, U.S. House of Representatives, U.S. Senate, White House, J.P. Morgan Asset Management. Data are as of September 18, 2026.
Instead the economic..2
Source: Standard & Poor’s, FactSet, J.P. Morgan Asset Management. Data are as of September 18, 2026.
Markets dont like..2
Source: Standard & Poor’s, FactSet, J.P. Morgan Asset Management. Data are as of September 18, 2026.
markets and economy..2
Source: BEA, Standard & Poor’s, FactSet, J.P. Morgan Asset Management. Data is calendar year. Guide to the Markets – U.S. Data are as of September 18, 2026.
Featured

Navigating through the trade policy fog

Discover how shifting tariffs and global supply chain dynamics are shaping U.S. trade policy, market impacts and business strategies in 2026.

Download presentation
Download the speaker notes
GettyImages-879685534

Latest Insights

The information presented is not intended to be making value judgments on the preferred outcome of any government decision or political election.

This website is a general communication being provided for informational purposes only. It is educational in nature and not designed to be a recommendation for any specific investment product, strategy, plan feature or other purposes. By receiving this communication you agree with the intended purpose described above. Any examples used in this material are generic, hypothetical and for illustration purposes only. None of J.P. Morgan Asset Management, its affiliates or representatives is suggesting that the recipient or any other person take a specific course of action or any action at all. Communications such as this are not impartial and are provided in connection with the advertising and marketing of products and services. Prior to making any investment or financial decisions, an investor should seek individualized advice from personal financial, legal, tax and other professionals that take into account all of the particular facts and circumstances of an investor's own situation.


Variable annuity guarantees are only as good as the insurance company that gives them. While it is an uncommon occurrence that the insurance companies that back these guarantees are unable to meet their obligations, it may happen. Annuity withdrawals prior to 59½ may be subject to tax penalties, are subject to market risk and may lose value. Riders have additional fees and costs associated with them, and are subject to additional conditions, restrictions, and limitations.


Opinions and statements of financial market trends that are based on current market conditions constitute our judgment and are subject to change without notice. We believe the information provided here is reliable but should not be assumed to be accurate or complete. The views and strategies described may not be suitable for all investors.


INFORMATION REGARDING MUTUAL FUNDS/ETF: Investors should carefully consider the investment objectives and risks as well as charges and expenses of a mutual fund or ETF before investing. The summary and full prospectuses contain this and other information about the mutual fund or ETF and should be read carefully before investing. To obtain a prospectus for Mutual Funds: Contact JPMorgan Distribution Services, Inc. at 1-800-480-4111 or download it from this site. Exchange Traded Funds: Call 1-844-4JPM-ETF or download it from this site.


J.P. Morgan Funds and J.P. Morgan ETFs are distributed by JPMorgan Distribution Services, Inc. JPMorgan Private Markets Fund and JPMorgan Credit Markets Fund are distributed by J.P. Morgan Institutional Investments Inc. Both are affiliates of JPMorgan Chase & Co. Affiliates of JPMorgan Chase & Co. receive fees for providing various services to the funds. JPMorgan Distribution Services, Inc. is a member of FINRA FINRA's BrokerCheck.


INFORMATION REGARDING SEPARATELY MANAGED ACCOUNTS AND MODELS: Investment advisory services are provided by J.P. Morgan Investment Management Inc.


INFORMATION REGARDING COMMINGLED FUNDS: For additional information regarding the Commingled Pension Trust Funds of JPMorgan Chase Bank, N.A., please contact your J.P. Morgan Asset Management representative.


The Commingled Pension Trust Funds of JPMorgan Chase Bank N.A. are collective trust funds established and maintained by JPMorgan Chase Bank, N.A. under a declaration of trust. The funds are not required to file a prospectus or registration statement with the SEC, and accordingly, neither is available. The funds are available only to certain qualified retirement plans and governmental plans and is not offered to the general public. Units of the funds are not bank deposits and are not insured or guaranteed by any bank, government entity, the FDIC or any other type of deposit insurance. You should carefully consider the investment objectives, risk, charges, and expenses of the fund before investing.


INFORMATION FOR ALL SITE USERS: J.P. Morgan Asset Management is the brand name for the asset management business of JPMorgan Chase & Co. and its affiliates worldwide.


NOT FDIC INSURED | NO BANK GUARANTEE | MAY LOSE VALUE


Telephone calls and electronic communications may be monitored and/or recorded.
Personal data will be collected, stored and processed by J.P. Morgan Asset Management in accordance with our privacy policies at https://www.jpmorgan.com/privacy.


If you are a person with a disability and need additional support in viewing the material, please call us at 1-800-343-1113 for assistance. 


Copyright © 2026 JPMorgan Chase & Co., All rights reserved