Multiemployer Pension Relief: “Running On Empty”
09/07/2021
Michael Buchenholz, CFA, FSA - Head of U.S. Pension Strategy, Institutional Strategy and Analytics
Alex Schneider, CFA - Taft-Hartley Client Advisor
Thomas Villanova, CAIA, CFA - Taft-Hartley Client Advisor
In Brief
- Special Financial Assistance (SFA) fund recipients are faced with a monumental challenge. They must take funds designed to last only 30 years under unrealistically optimistic conditions and somehow set themselves on a path toward long-term solvency.
- Without a change to the legacy portfolio investment policy, most SFA recipients won’t reach 2051.
- The long life of the SFA, absorbing cash outflows, greatly enhances the tolerance for illiquidity in the legacy asset pool. The larger the SFA relative to legacy assets, the longer its expected life and the higher the illiquidity budget in legacy assets.
- The most impactful action to improve plan solvency is to risk-up the legacy portfolio, doing away with the redundant core bond allocation and increasing private market alternatives.
- Alpha generation will be critical to survival and, given the allocations, manager selection in alternatives will be paramount.
- Mild expansions of the SFA investment rules, like allowing high yield, won’t have a big impact. However, expanding the opportunity set to public equity would significantly enhance flexibility, reduce required return targets for the legacy assets and maximize the probability of success.
- Having a strategic framework for investing both legacy and SFA asset pools will be imperative. As returns and demographic experience are realized, and especially as legislation is updated, the optimal investment solution will evolve.
Introduction
Imagine you’re a big rig trucker with an assignment to drive an important load cross country – one which over 3 million Americans are depending on. But there’s a big catch: you only have half a tank of diesel and you can only use first gear. It seems an impossible undertaking, but this situation isn’t too dissimilar from the task facing ARPA Special Financial Assistance (SFA) funds recipients who are charged with securing their future with inadequate additional funds and tight restrictions on eligible investments.
Without the flexibility to use higher gears the driver won’t get very far. Similarly, to have any shot of meeting their objectives, plans need to be given the freedom to shift out of the lowest gear in their investment opportunity set – public investment-grade fixed income. Even with access to all the gears, the driver still doesn’t have enough fuel. Avoiding brakes, coasting down hills and optimizing fuel efficiency will get the truck farther, but even doing everything right the driver is highly unlikely to reach his destination. In the same way, plans that are able to meet or exceed their expected return assumptions may still run out of assets, many even before the 30-year period the legislation intends to secure. Like the trucker with an impossible assignment, ARPA recipients may only be able to stretch their resources, biding time for another legislative fix or worse, hoping for a miracle.
In the remainder of this paper, we briefly discuss how Taft-Hartley plans arrived at this point, outline what ARPA does and doesn’t do and discuss our recommended investment solutions for groups of ARPA recipients facing varying circumstances.
How We Got Here
Taft-Hartley defined benefit plans flourished through the 1980s and 90s under rising equity markets and plentiful work for organized labor. During the following decade, funded status levels deteriorated due to a range of factors: increasing life expectancy, dwindling union membership and aging plans (Exhibit A), employer bankruptcies leaving “orphaned” plan participants (Exhibit B), benefit increases to enhance contribution tax deductibility and, most importantly, two equity market crashes in the dot-com bubble of 2000 and great financial crisis of 2008. Facing just one of these headwinds, most plans likely would have persevered. However, the combination of factors has led to the current situation where many of these plans need relief to continue paying promised benefits.
Exhibit A: Multiemployer Pension Demographics Have Shifted Dramatically
Active participants paying into the system have shrunk while inactives receiving payouts has ballooned

Source: 5500 EBSA Abstract, JPMorgan Calculations.
Exhibit B: Select Industry Demographic Statistics
“Orphaned” participants, whose employers are no longer contributing, make up almost 16% of all plan participants

Source: JPMorgan Calculations, 2019 DOL 5500 Schedule R and Schedule MB.
In 2014, the Multiemployer Pension Reform Act (MPRA) attempted to bring stability to plans facing potential insolvency by allowing applications for benefits cuts. Unfortunately, very few cuts have been approved, while many plans continue trending toward collapse. The failure of MPRA left a need for a new legislative fix, which came in March 2021 in the form of the American Rescue Plan Act (ARPA).
ARPA Overview
APRA is intended to provide multiple forms of relief for multiemployer plans:
- Direct Funds: Most importantly, the legislation creates a Pension Benefit Guaranty Corporation (PBGC) fund to provide special financial assistance (SFA) to deeply troubled plans. The size of assistance is meant to approximate the additional funds needed to pay full unreduced participant benefits for the next 30 years. However, as we will explore in the next section, the adequacy of any assistance depends heavily on the actuarial assumptions used for estimation and the range of permissible asset classes in which it can be deployed.
- Regulatory Relief: For SFA-ineligible plans, temporary relief is available in the form of lengthened amortization periods, extended funding improvement timelines for endangered or critical plans and delayed designation of deteriorating zone status.
In addition to the measures above, PBGC premiums, currently $31 per participant and indexed to inflation, will jump to $52 per participant in 2031 with continued inflation indexing. Assuming annual inflation of 2.5% per year, the expected change represents a roughly $12 or 30% increase.
WHAT PLANS ARE ELIGIBLE TO RECEIVE SFA?
Eligible plans are those that satisfy any one of four requirements:
- The plan is certified to be in critical and declining status in any plan year beginning in 2020 through 2022.
- The plan had an approved suspension of benefit under MPRA as of the date of the enactment of the American Rescue Plan (March 11, 2021).
- The plan is certified to be in critical status in any plan year beginning in 2020 through 2022 AND the plan has a current liability-funded percentage of less than 40% AND the plan has an active to inactive ratio that is less than 67%.
- The plan became insolvent after December 16, 2014, has remained insolvent and has not been terminated as of the date of the enactment of the American Rescue Plan.
Where Does ARPA Stand Now?
While signed into law on March 11, 2021, many of the program details were left open to interpretation. On July 9, the PBGC clarified its reading of the law by issuing the Interim Final Rule (IFR), new regulations outlining the rules of the road for implementation of ARPA. Among the most highly anticipated details were the guidelines for determining the amount of SFA each plan could receive, as well as the investment restrictions placed on those SFA funds. In fact, it is these two guidelines that lead to the paradoxical investment proposition multiemployer plans are facing, much like the truck driver tasked with the impossible assignment. The goal of ARPA was to provide a solution to the multiemployer crisis, rather than a temporary bandage. In the remainder of this paper, we assess how likely the legislation is to achieve its objective and provide recommended investment solutions for three different archetypal plans facing challenges of varying difficulty.
Discussion of Investment Challenges Facing SFA Recipients
SFA Amount
In order to conceptualize the challenges facing recipients of SFA funds, it is necessary to get a little bit into the weeds on SFA sizing. The legislation defines the SFA as the “amount required for the plan to pay all benefits due during the period beginning on the date of payment of the special financial assistance payment under this section and ending on the last day of the plan year ending in 2051 . . . .” On one hand, this could have been interpreted as assistance equivalent to the next 30 years of benefit payments. At the other extreme, this could have meant enough assistance such that, in combination with existing resources and future expected inflows, the plan could maintain solvency through 2051. The PBGC’s interpretation was in line with the latter. So right off the bat, the regulations lower the bar from a permanent multiemployer solution to one whose goal is simply to reschedule insolvency to a point 30 years in the future.
SFA Valuation Discount Rate
The most important assumption in translating a sizing objective into an actual dollar amount is the discount rate. The legislation defined the interest rate as the lesser of:
- Expected Return Assumptions: The long-term expected return on assets used in the most recent certification of plan status.
- Interest Rate Limit: The third segment rate under ERISA Section 303(h) plus 200 basis points1. This third segment rate corresponds to the yields on high quality, A or better rated, corporate bonds with maturities of 20 years or greater and is averaged over 24 months6. As of August 2021, this segment rate was 3.38%, leading to an interest rate limit of 5.38%.
In Exhibit C, using the valuation liability interest rate assumptions from 2019 regulatory filings, we can get a sense for the range of expected return assumptions. While this group includes all plans, not just those eligible for receiving SFA, we see that more than 97% of plans would be subject to the interest rate limit, and thus to using a roughly 5.4% discount rate as of August 2021. In isolation, this discount rate regulation is actually helpful. After all, it is easier to earn 5.4% than to generate returns of 7.0% or greater. However, the challenge arises when we pair the discount rate with the limitations on how SFA funds can be invested.
Exhibit C: Plan Valuation Rate Assumptions Above and Below the Limit
The vast majority of plans use a valuation rate above the limit and will need to use a discount rate of nearly 5.4%
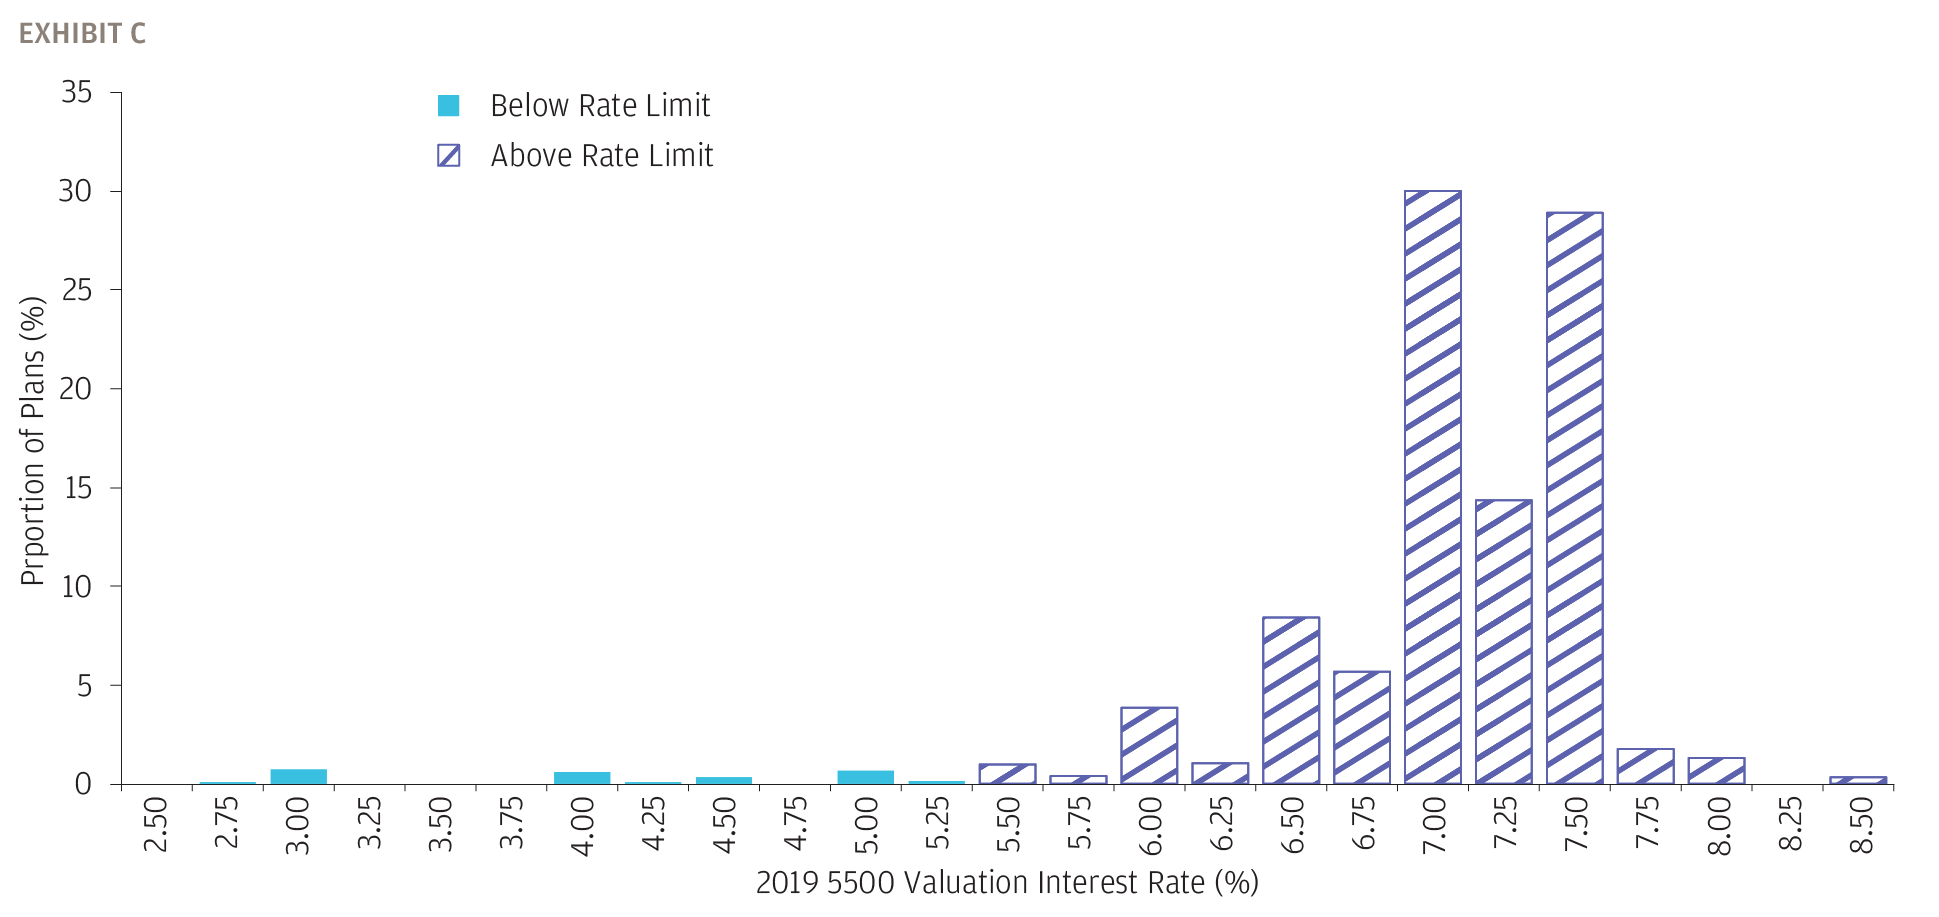
Source: Valuation interest rates are from the 2019 DOL Form 5500, Schedule MB, Line 6d. The interest limit is based on the 24-month average corporate bond third segment rates as of August 2021, published by the IRS.
Restrictions on SFA Investments
ARPA and the PBGC’s subsequent IFR regulation place several restrictions on the use and investment of SFA funds:
- SFA funds must be segregated from other plan assets.
- SFA funds and any corresponding earnings can only be used to make benefit payments and pay plan expenses.
- Plan must maintain at least one year of benefit payments and expenses in investment-grade fixed income across plan assets, including the SFA.
- SFA funds must be invested in publicly traded, US dollar-denominated, investment-grade fixed income. Up to 5% in fallen angels, securities originally purchased at investment grade but subsequently downgraded to high yield, are permitted to be held.
The final investment criteria are where the major problem emerges. Most eligible plans will be determining the size of their SFA with a discount rate of 5.4%, but investment options are limited to investment-grade fixed income. As measured by the Bloomberg Barclays U.S. Aggregate Index, the investment-grade fixed income universe yielded 1.4% as of July 31st (closer to 1.3% if we adjust for expected credit losses), a gap of roughly 400 basis points. Exhibit D compares the default-adjusted yields, market yields less expected credit losses, on eligible investments to the SFA discount rate limit. There is no asset class that achieves the SFA rate, but even getting close entails taking on significant interest rate risk in the form of higher asset duration (see callout box on How Much Can You Earn in the SFA for a discussion of appropriate duration sizing in SFA funds). The PBGC has asked for comment from industry participants on the effect of this investment limitation and may be open to expanding the opportunity set. However, for the time being plans must proceed under the assumption that only investment-grade fixed income will be permissible.
Exhibit D: Default-Adjusted Yields of Eligible Investments as of 7/31/2021
There are no eligible asset classes that earn the SFA rate, but even getting close entails taking on significant interest rate risk
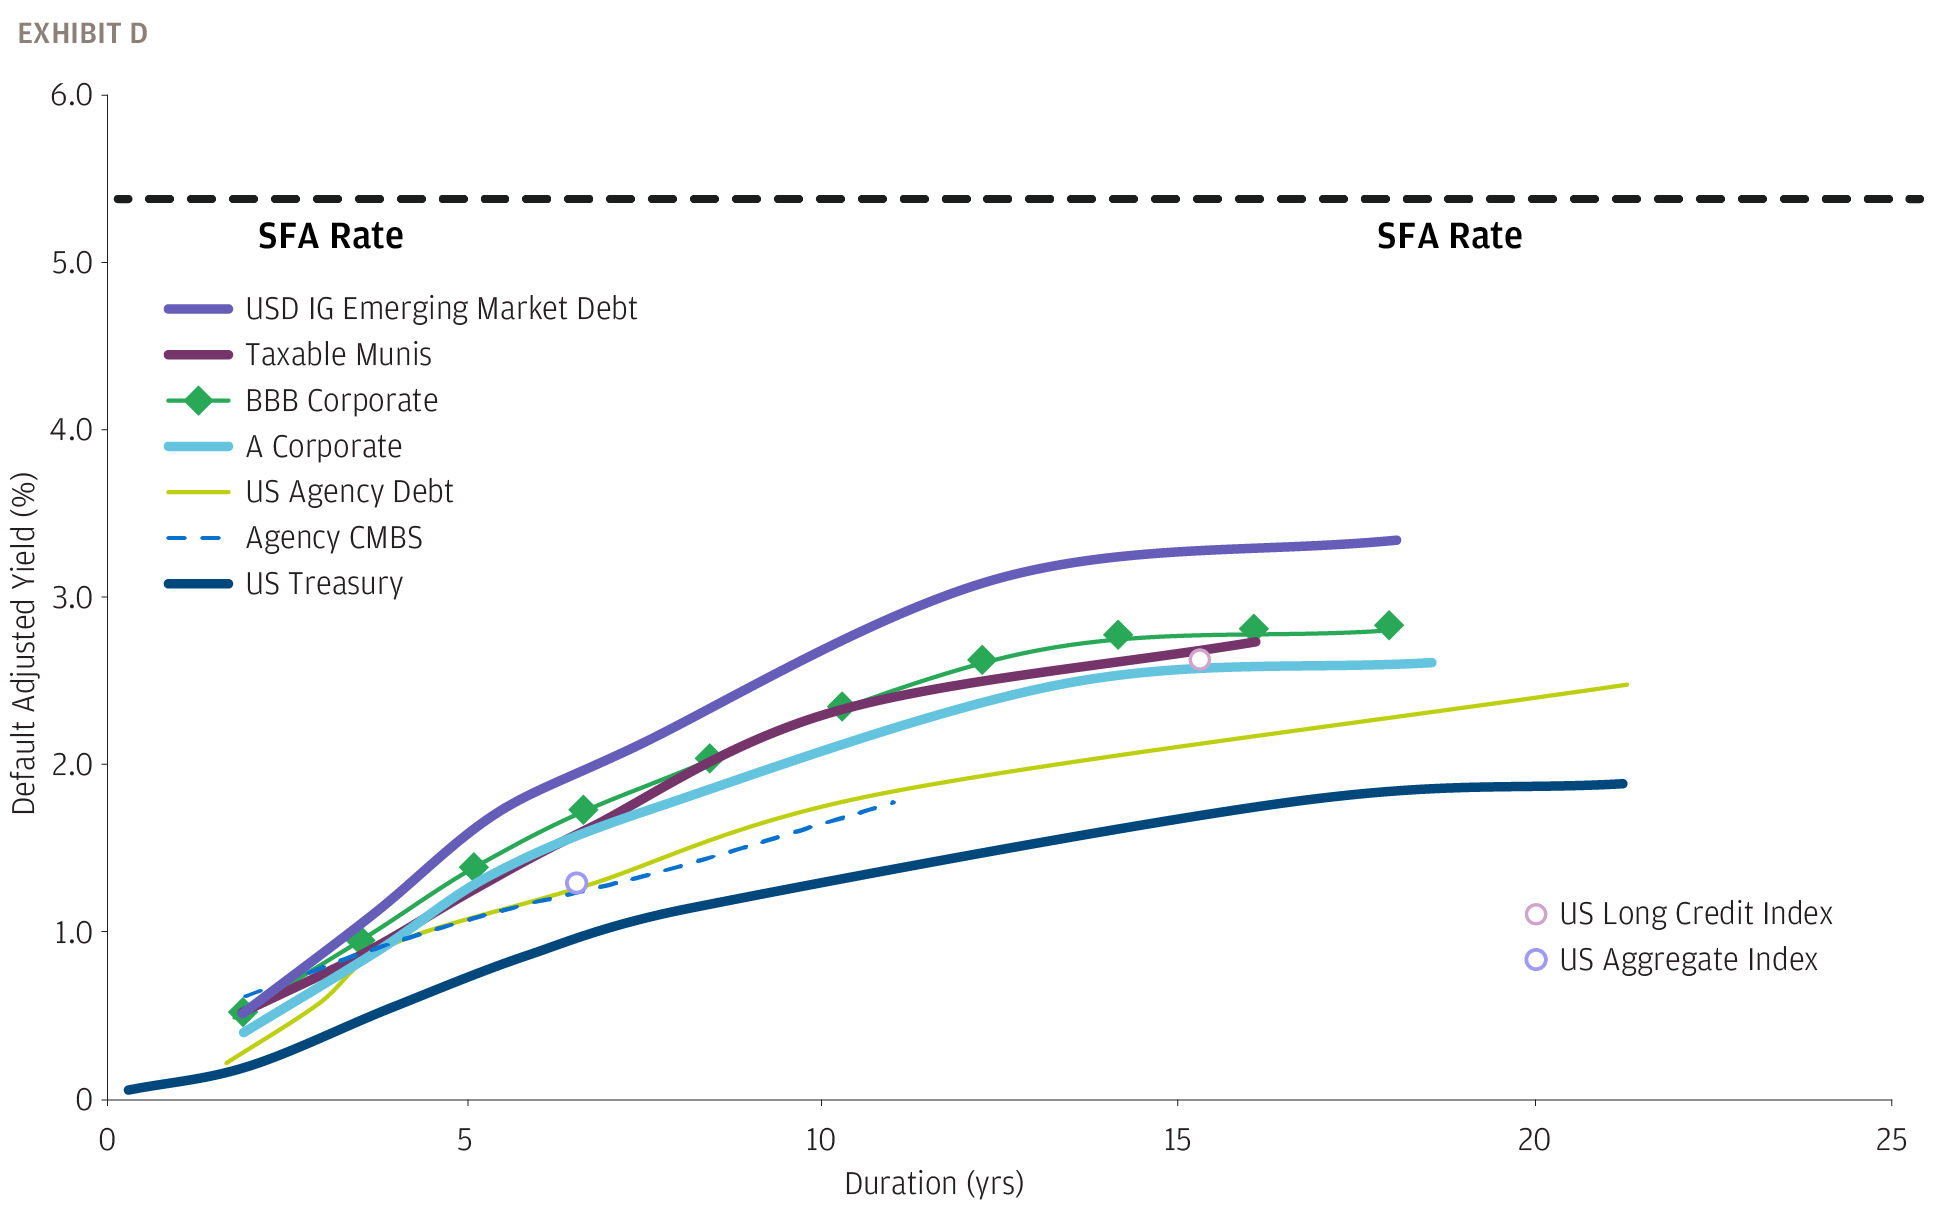
Source: Bloomberg Barclays, IRS, JPMorgan Calculations, Moody’s.
In summary, SFA fund recipients are faced with a monumental challenge. They must take funds, designed to last only 30 years under unrealistically optimistic conditions2, and somehow set themselves on a path toward long-term solvency. In the next section, we dive into some specific examples of how plans can approach this puzzle3.
Case Studies: Three Archetypal Plans
Thus far we’ve laid out a sober assessment of the challenges facing SFA recipients. However, it is not necessarily all bad news. An inability to earn the SFA rate of 5.4% is a near certainty as a consequence of the current investment limitations, but that doesn’t mean plans are inevitably doomed to failure. It simply means their existing assets will have to work harder. However, as the SFA portion of total funds increases, this challenge becomes more daunting.
In Exhibit E, we examine three archetypal plans with different size SFA allocations: 1.0x, 2.0x and 3.0x of current assets. Unsurprisingly, lower funded status levels, all else equal, will lead to larger SFA allocations. But these higher SFA allocations earning significantly less than the discount rate also means higher returns from legacy assets are required to survive until 2051, let alone remain solvent indefinitely. Exhibit E assumes a 1.6% SFA return, which we believe can reasonably be achieved with a diversified portfolio (see callout box for how we arrived at 1.6%), leading to legacy asset required returns in the range of 6.0% to 8.2% depending on the objective. Based on JPMorgan’s most recent Long-Term Capital Market Assumptions, getting to 7.0% based on beta only is a near impossibility and getting close in practice requires a full toolkit of investment capabilities. However, when we examine the lifetime of the SFA, the total number of years before the last dollar of SFA funds is expected to be exhausted, we see a range of roughly 9 to 12 years. With the SFA funding all benefit payments, expenses and PBGC premiums, this means that legacy assets can compound untouched for a decade. This suggests a much higher tolerance for illiquid alternative assets in the legacy assets than might otherwise be acceptable.
Exhibit E: Archetypal Plans – Required Returns Assuming an 1.6% SFA Return
Based on JPMorgan’s Long-Term Capital Market Assumptions, returns in excess of 6.5% - 7.0% will be extremely difficult to achieve
.png)
Source: JPMorgan Calculations based on hypothetical projection of expected benefit payments and administrative expenses, including PBGC premiums and contributions. Figures are highly sensitive to these and other disclosed input assumptions.
HOW MUCH CAN YOU REASONABLY EARN ON THE SFA, AND WHAT IMPLICATIONS DOES THAT HAVE FOR THE LIQUIDITY PROFILE OF LEGACY ASSETS?
Like many, our initial instinct was to simply invest the SFA in core bonds, benchmarked to the Bloomberg Barclays US Aggregate Index, a broad representation of the entire investment-grade fixed income market. However, when we model out the weighted average life (WAL) of the SFA funds, we find that they are shorter than the core bond universe. Exhibit E shows that the WAL of our archetypal plans is roughly 4 to 5 years, while the duration of the US Aggregate Index is 6.6 as of August 20217. Exhibit F1 shows the WAL for a wider range of plans assuming an SFA return rate of 1.5% at the low end to 3.0% at the high end. Even for plans with many multiples of SFA funds to existing assets, the duration does not exceed that of the US Aggregate Index. By matching the duration of the liabilities that SFA funds will satisfy, we are mitigating the interest rate risk. Buying bonds that are shorter will lead to reinvestment risk and buying bonds that are longer will lead to price risk, as bonds will need to be liquidated before maturity (regardless of price) to fund benefits.
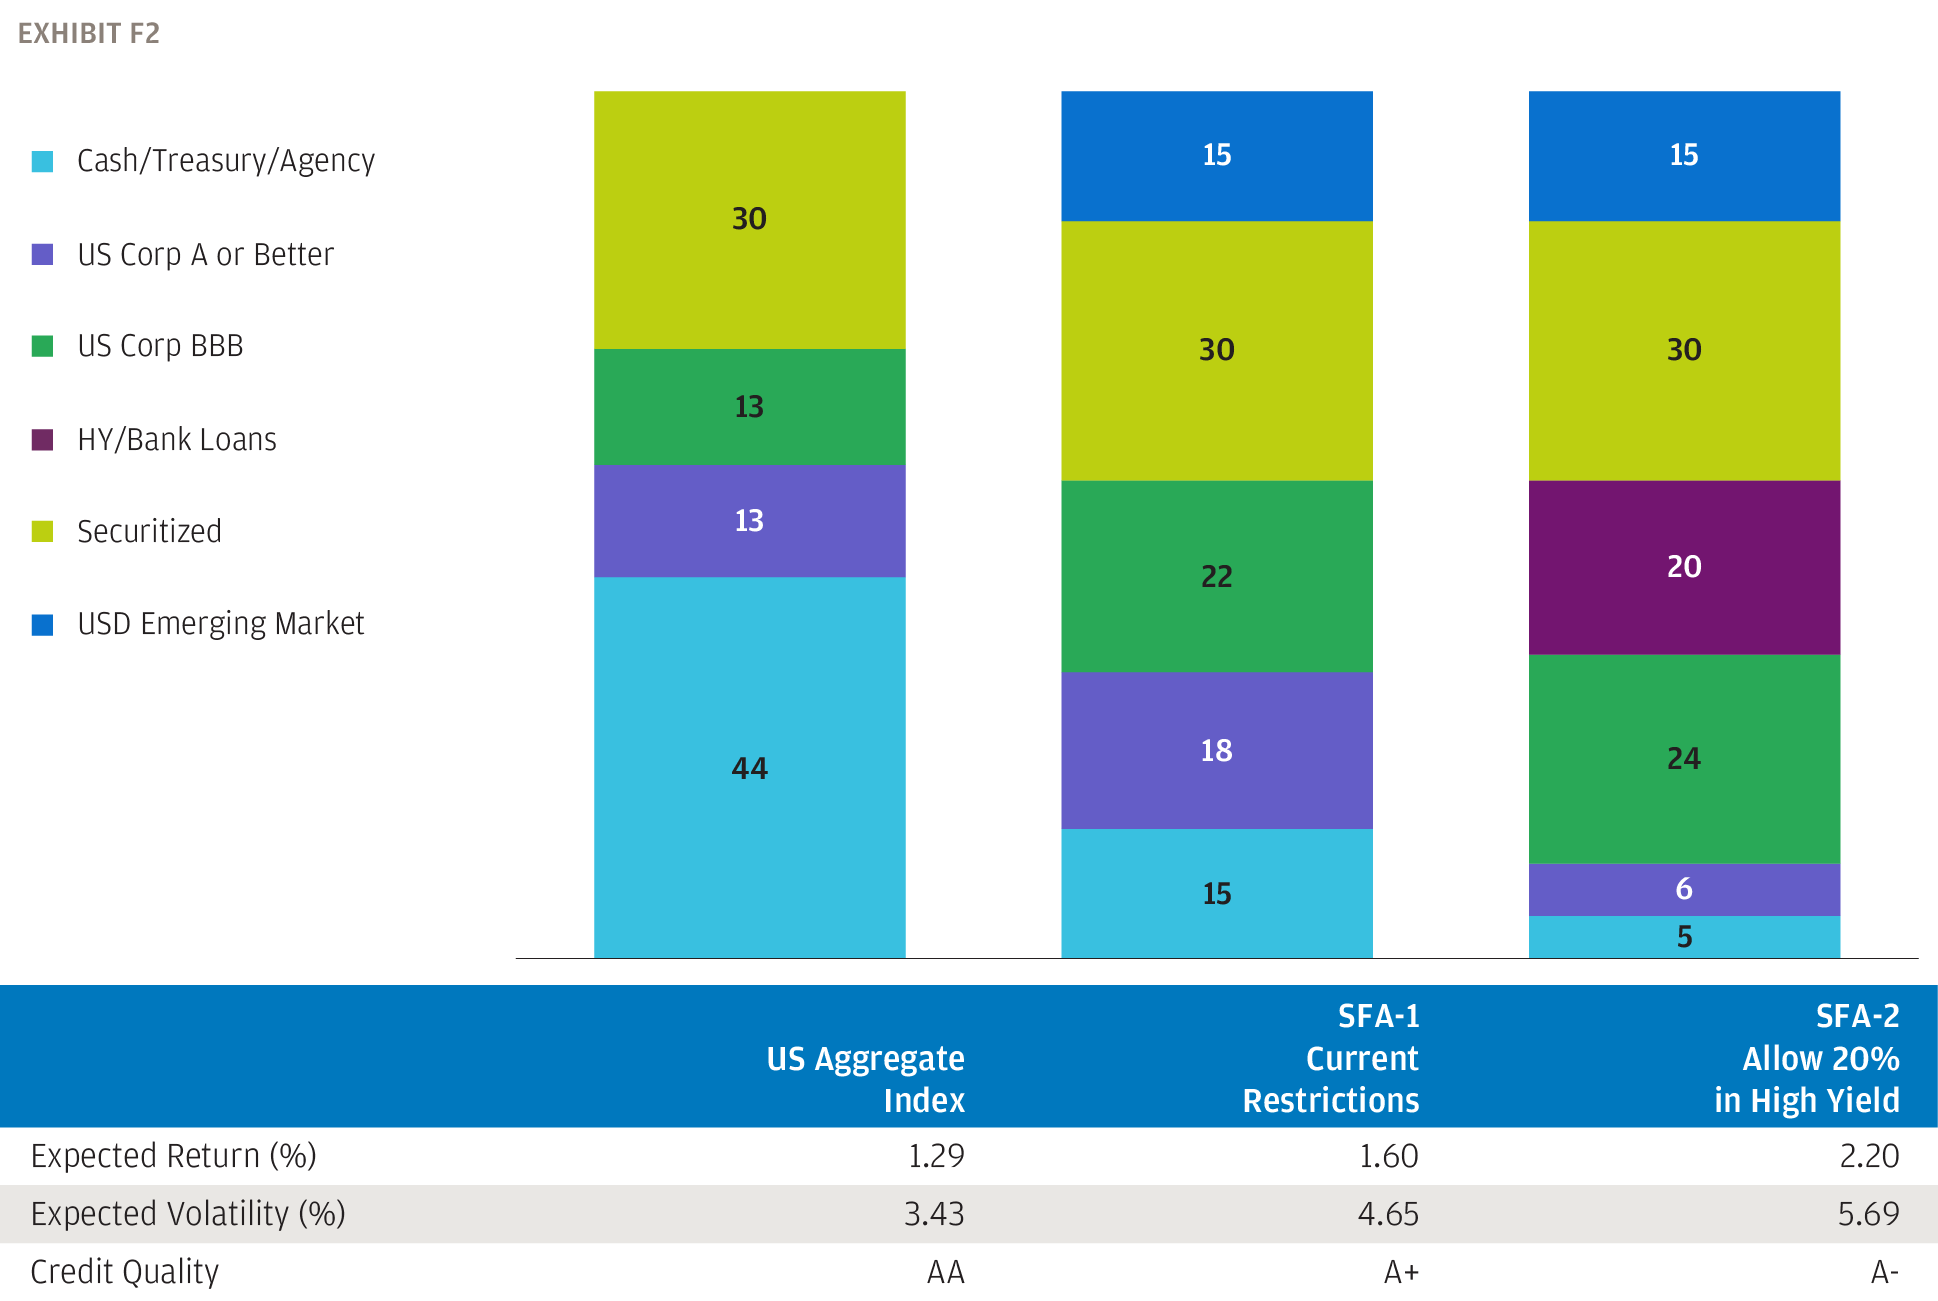
Not only is the US Aggregate Index overweight duration relative to the liabilities the funds will pay, it is not optimized for yield with nearly 75% in Treasuries and agency mortgages. We’ve constructed implementable portfolios that maximize yield and exhibit a duration profile similar to the liabilities they are meant to service (Exhibit F2). We find that, based on current market yields and investment restrictions, a return of 1.6% is achievable. If the restrictions are loosened moderately and allow up to 20% in below investment grade, we think a return of 2.2% is achievable, albeit with higher volatility.
Before we leave this section, there is one more takeaway from Exhibit F1. The total life of SFA funds tells how long the current assets have to compound before the resumption of outflows. The higher the returns on the SFA and the larger the SFA relative to existing assets, the longer this period of compounding will be. However, the most valuable insight this gives us is a tolerance for illiquid alternative asset classes. A 3.0x SFA recipient has a period of roughly 12 to 13 years where their legacy assets will not just have no outflows, but also they will have consistent inflows from contributions and possible withdrawal liability payments. This period of positive cash inflows should greatly increase the plan’s flexibility to invest in illiquid assets and allow for maximum return generation before the net cash flow profile reverses.
Exhibit F1: Weighted Average Life of SFA Under Most Scenarios Is Shorter Than US Aggregate Duration
Projected weighted average life and total life of SFA funds assuming SFA returns ranging from 1.5% to 3.0%
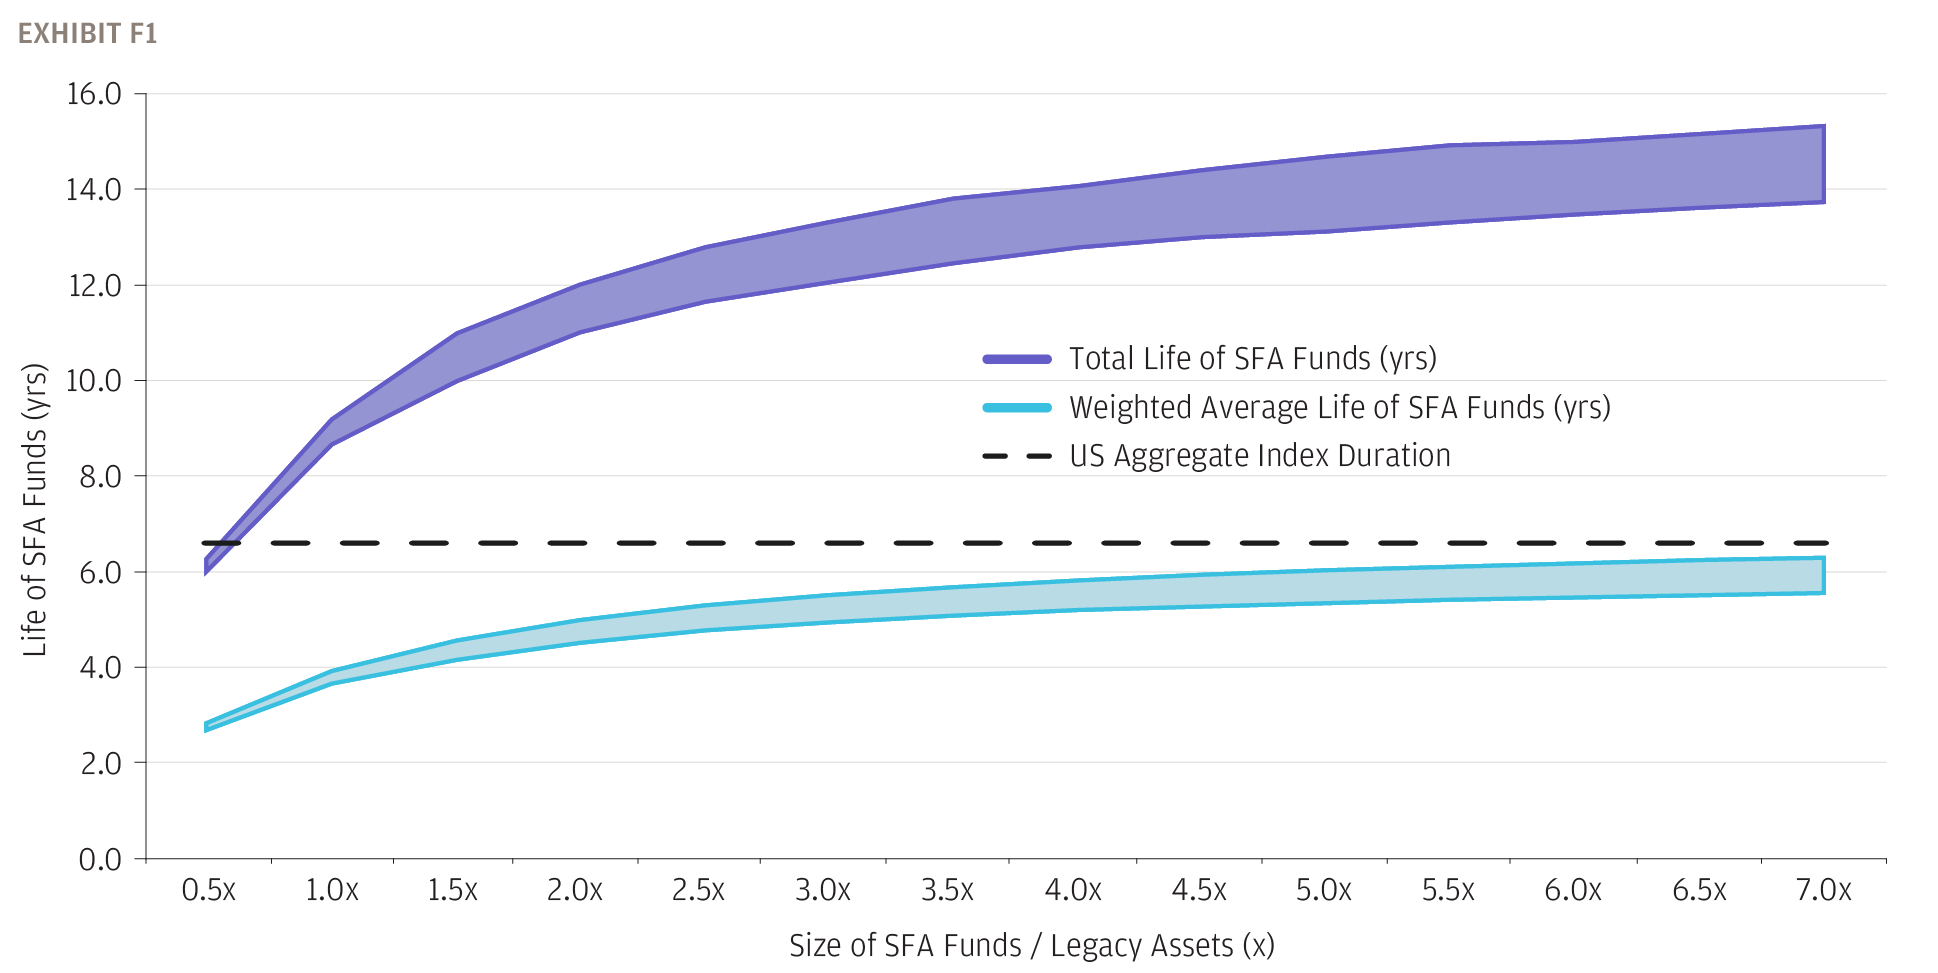
Exhibit F2: Model SFA Portfolios
Port SFA-1 is constructed under current investment limitations, while Port SFA-2 allows up to 20% in below-investment-grade fixed income
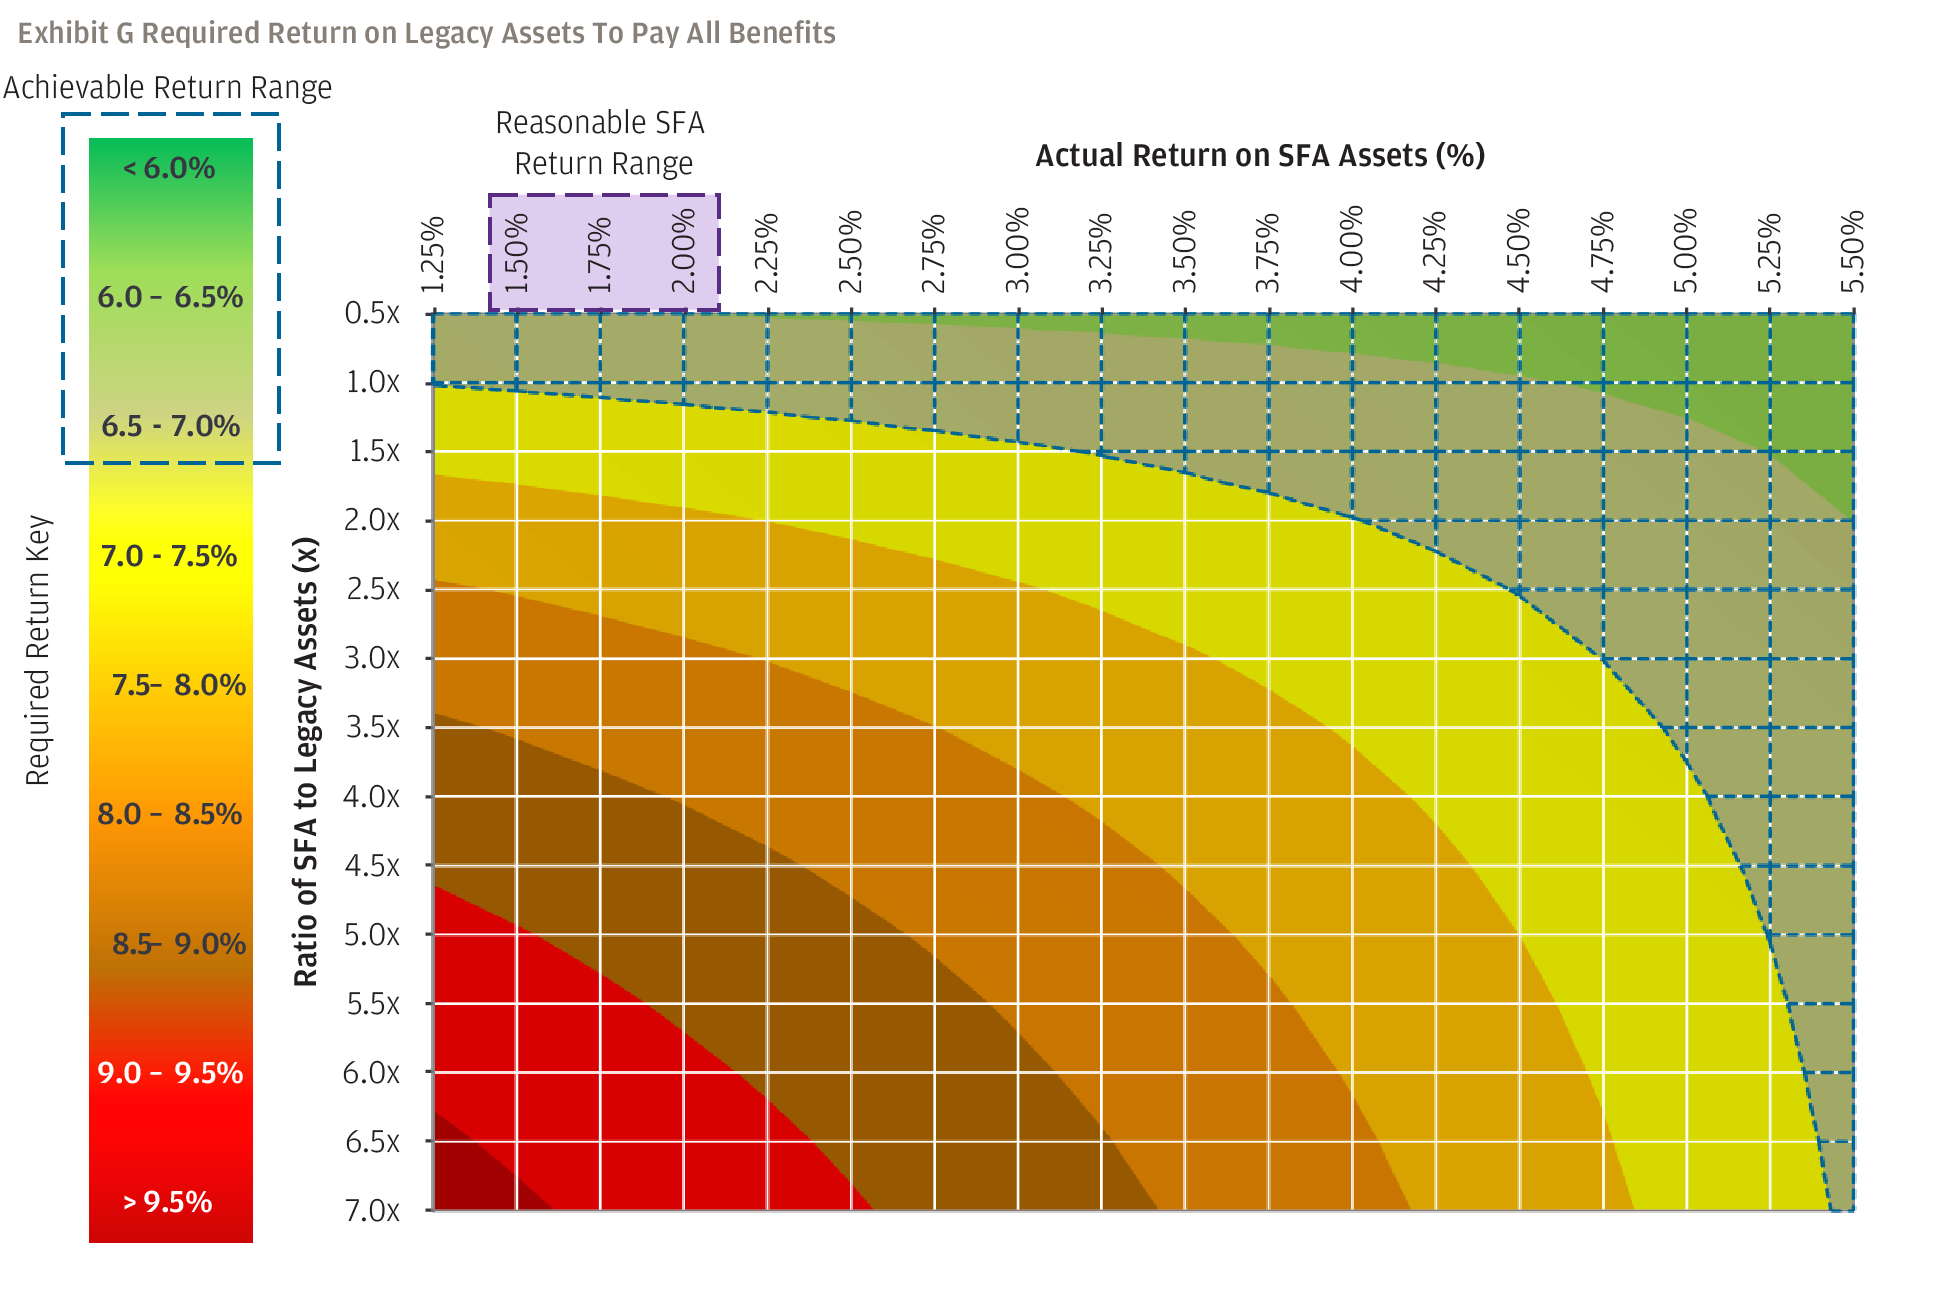
In fact, we can generalize this investment problem across a wider range of SFA fund sizes and expected returns (Exhibit G). The visual shows that the higher the ratio of SFA assets to legacy assets and the lower the return on SFA funds, the more challenging it will be to generate enough legacy asset returns to remain solvent.
Exhibit G: Required Return to Maintain Long-Term Solvency by Varying the Ratio of SFA to Legacy Assets and Actual Return on SFA Assets
The blue grid covers the range of required returns that are reasonably achievable based on JPMorgan’s Long-Term Capital Market Assumptions
Thus far we’ve been discussing required returns on hypothetical portfolios. Now we turn our attention to more tangible examples and produce portfolio analytics to better grasp the scope of the problem and potential solutions, including the hypothetical impact of expanding the SFA investment opportunity set.
Baseline Scenario: What Do We Expect With No Changes to Prevailing SFA Restrictions?
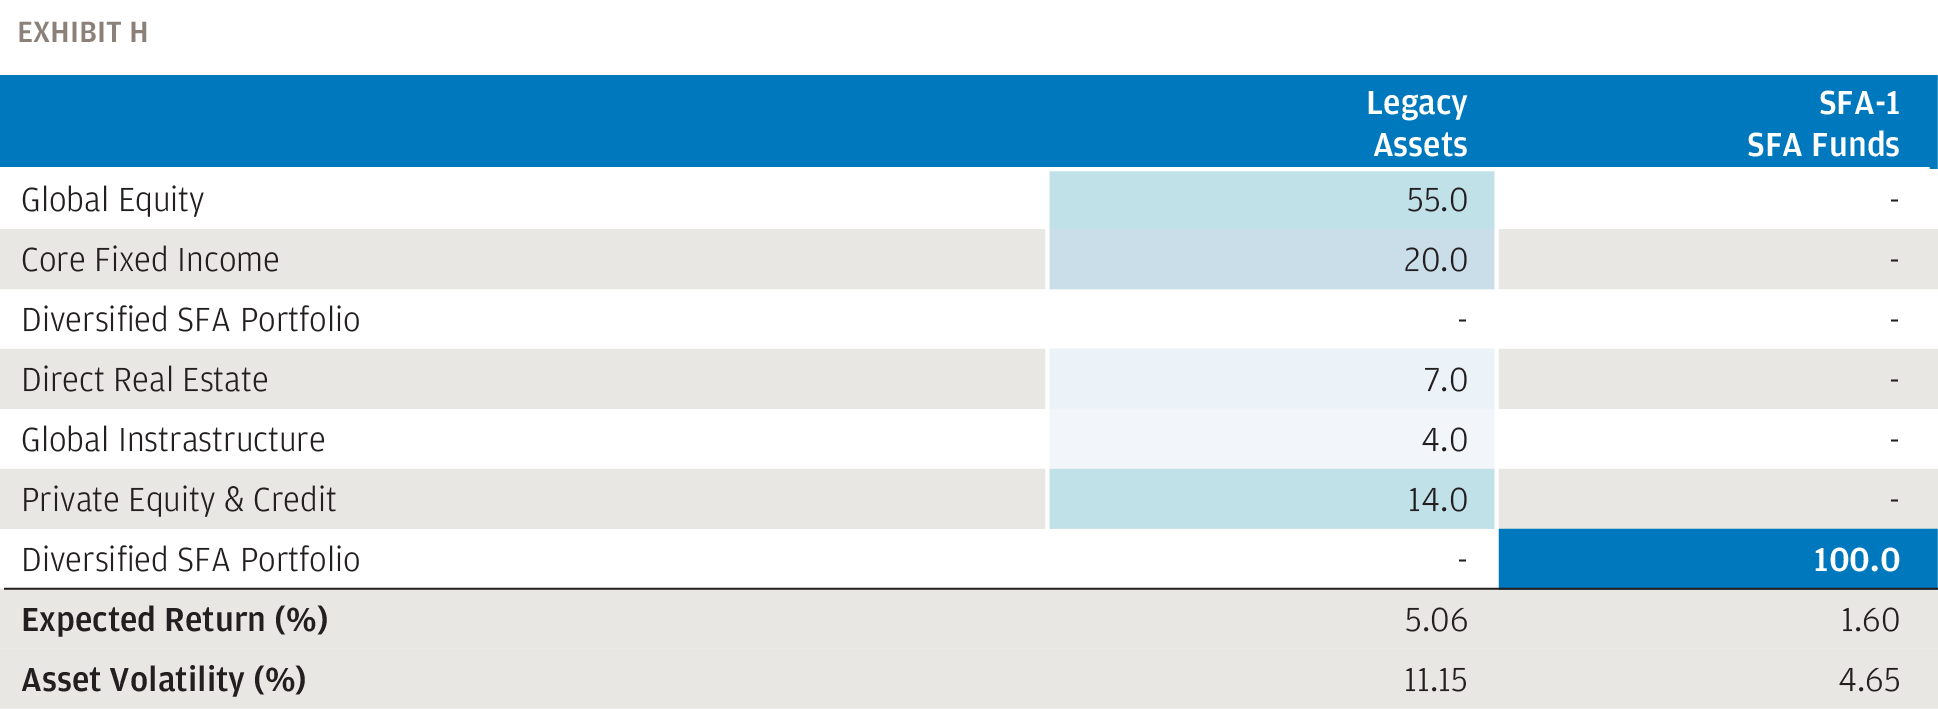
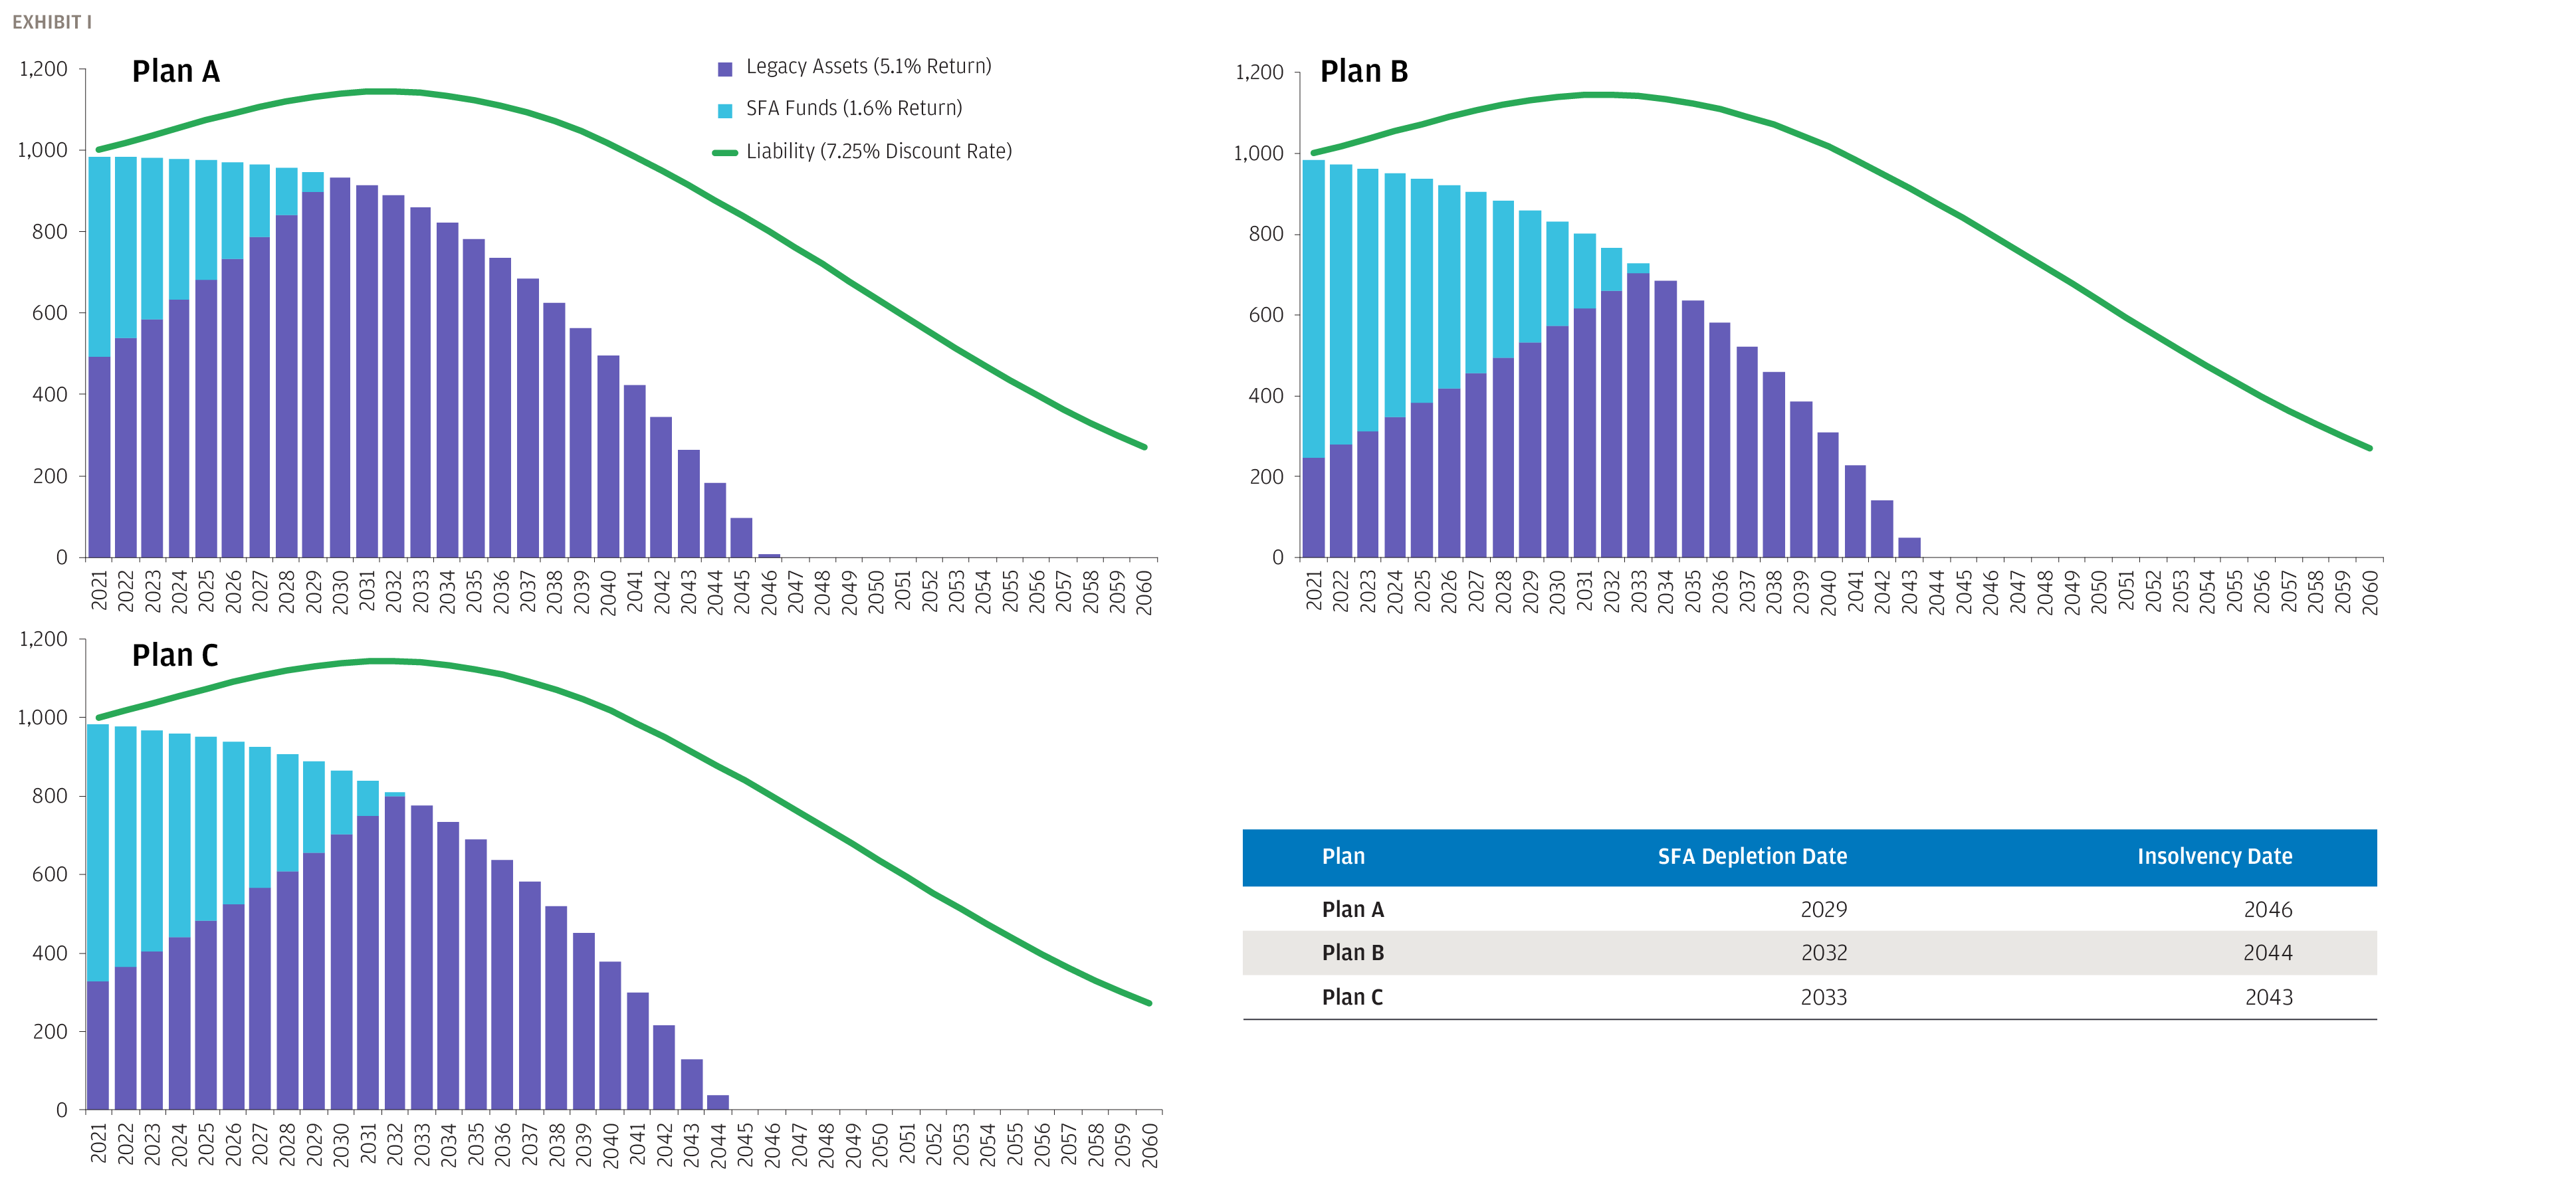
We take a typical Taft-Hartley allocation (Exhibit H), which has a 5.1% compound expected return4, and assume the SFA funds are invested in our 1.6% return diversified SFA portfolio, optimized under the current investment restrictions (see Exhibit F2). Exhibit I shows how both asset pools evolve over time for our three archetypal plans. The actual return on legacy assets falls short of the required returns we calculated earlier, and so unsurprisingly each plan becomes insolvent prior to the 2051 target date. However, we can visualize the power of the SFA on the ability of the legacy assets to compound untouched for the initial accumulation period.
Exhibit H: Baseline Allocations Within Legacy Assets & SFA Funds
The typical Taft-Hartley allocation falls short of the returns needed to maintain solvency in combination with SFA assets
Source: 5500 DOL Schedule R Filings, JPMorgan Estimates.
Exhibit I: Baseline Funding Projections
Each archetypal plan will deplete assets prior to 2051 unless reallocations are made
Source: JPMorgan Calculations.
What Can Investors Do to Increase the Mileage From Their Assets?
We just illustrated that simply investing SFA assets in investment-grade bonds and maintaining an average Taft-Hartley allocation within legacy assets isn’t going to get the portfolio very far. What changes can we make to improve the chances of survival far into the future? In the next exercise, we make incremental adjustments to both the SFA and legacy assets, running simulations to quantify the impact on plan survival. In order to be additive to the current dialogue around investment restrictions, we include changes to the SFA portfolio that are not currently permissible under the IFR.
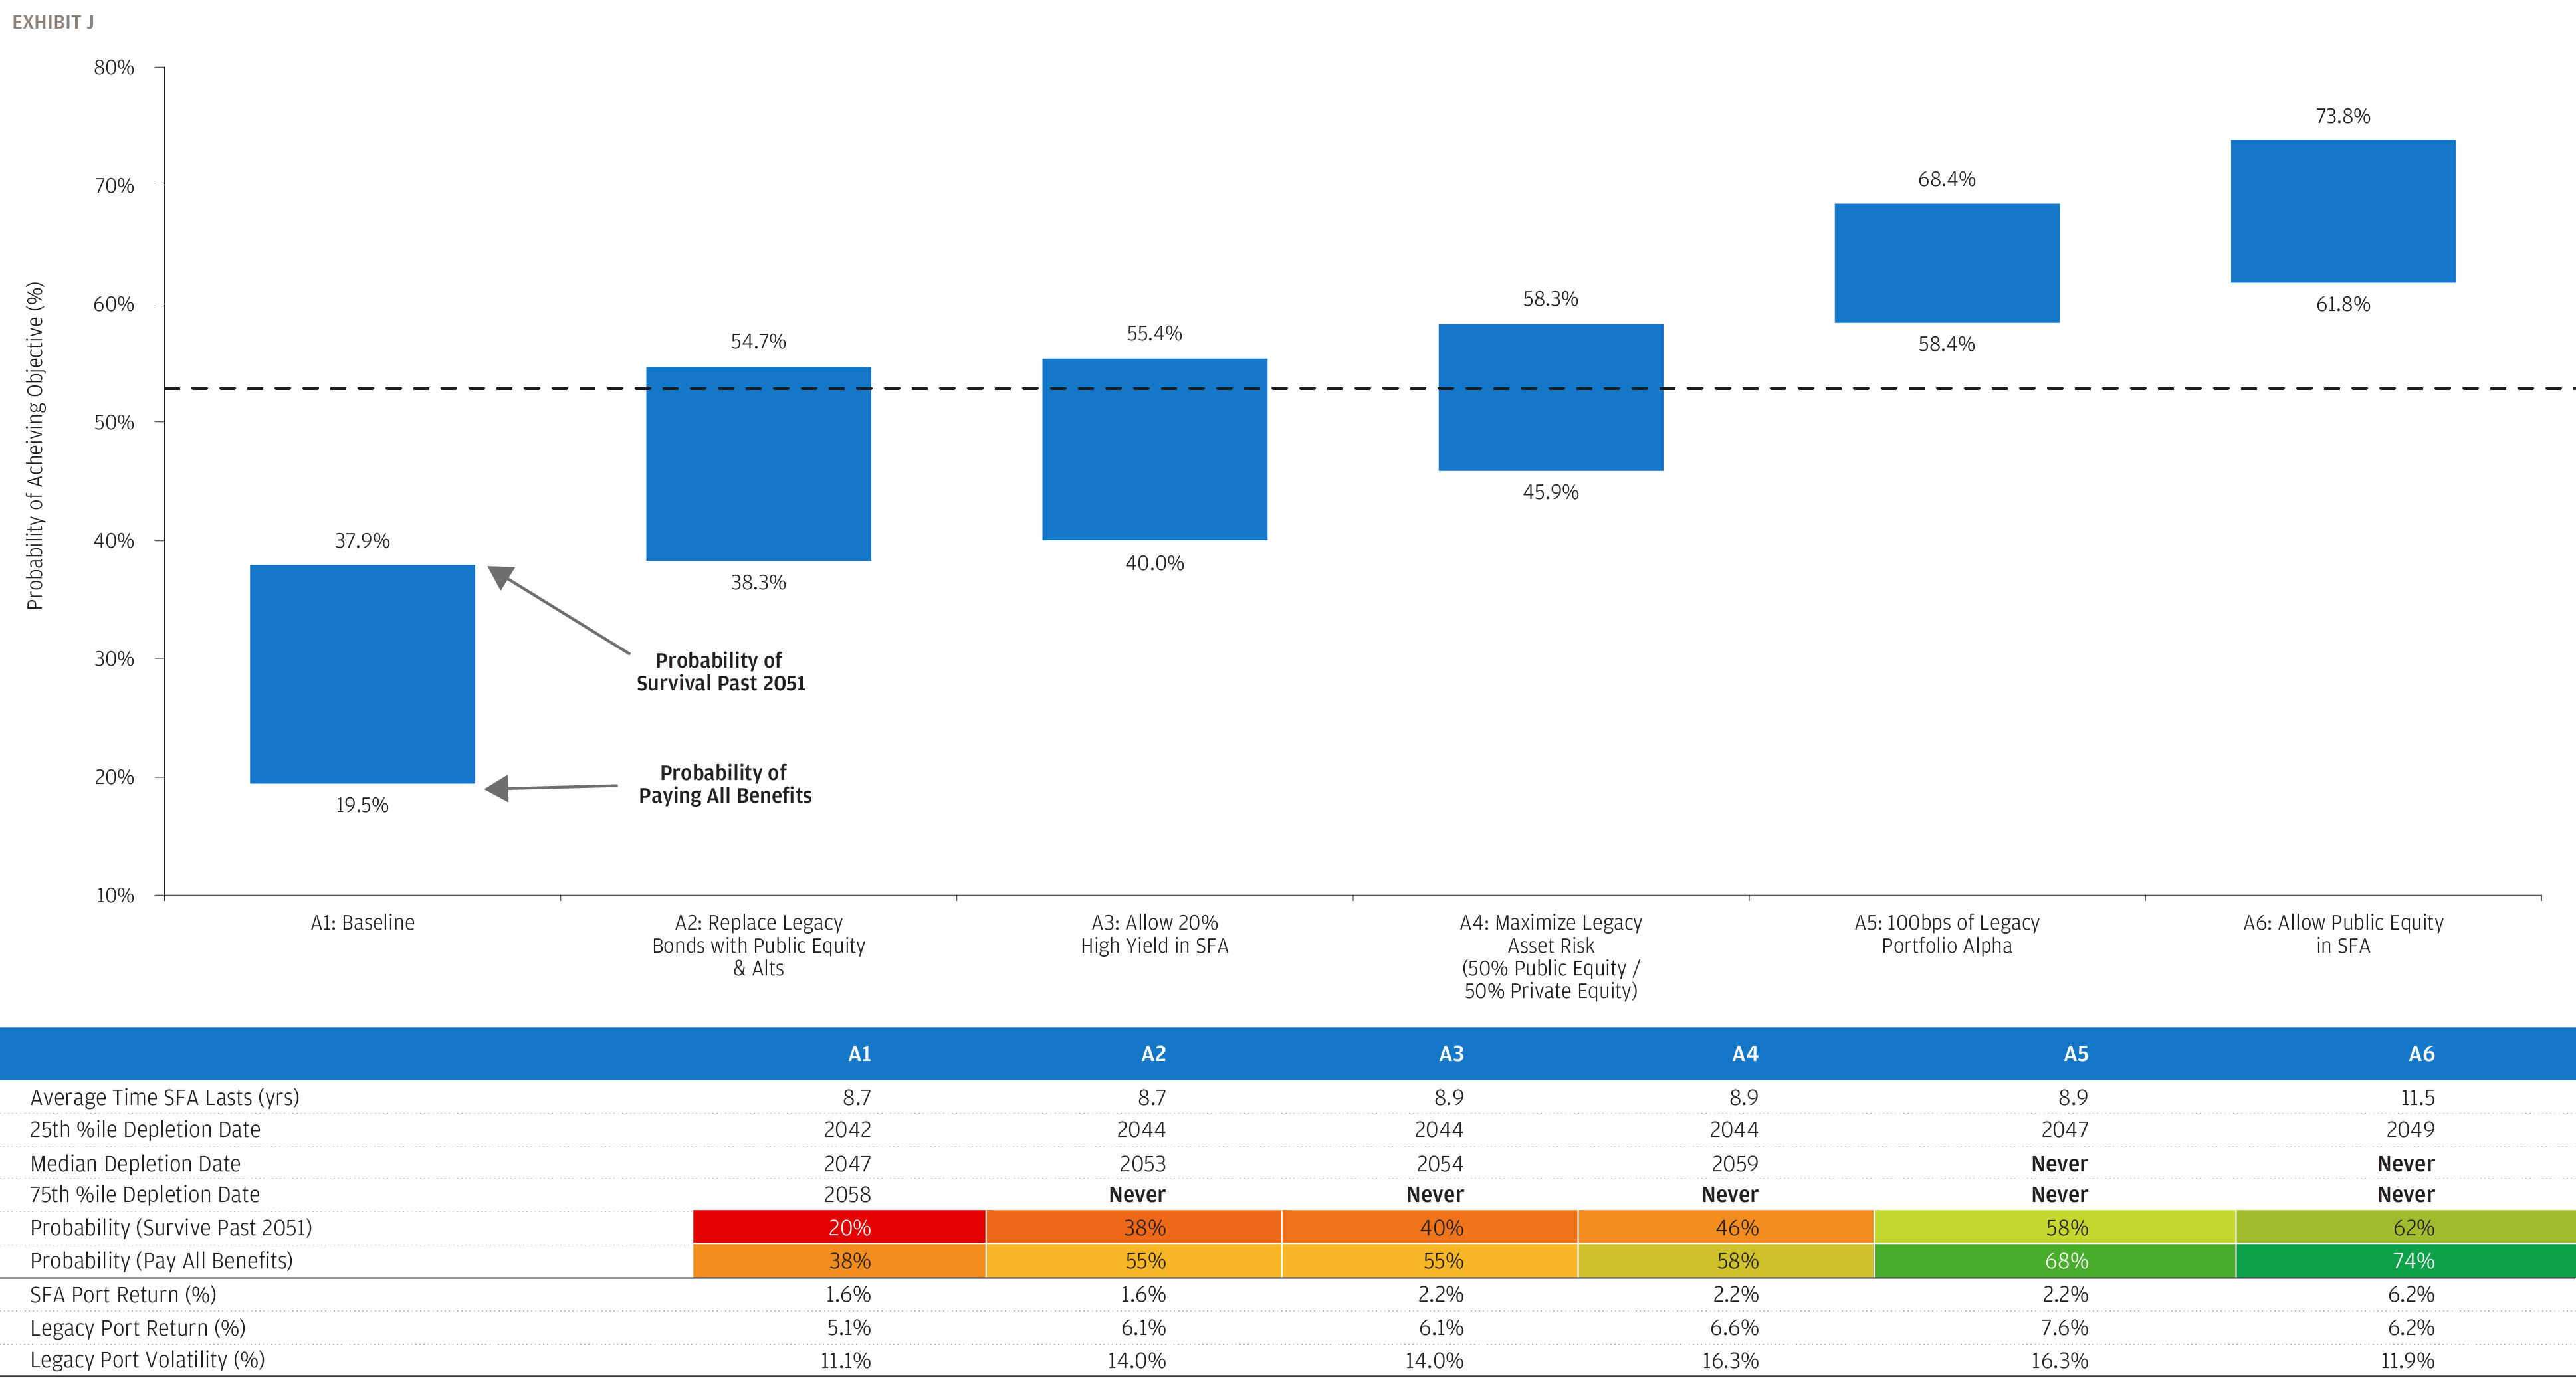
Exhibit J uses Plan A (SFA / Legacy Assets = 1.0x) and runs a monte-carlo simulation to generate analytics for incremental portfolio changes, each successive modification enhancing plan survival. We find that the most impactful action a plan can take is risking-up the legacy portfolio, doing away with a now redundant core bond allocation and increasing private market alternatives with the enhanced illiquidity budget provided by outflow-absorbing SFA assets. We also find that alpha generation will be critical to survival and, given the allocations, manager selection in alternatives will be paramount. Lastly, mild expansions of the SFA investment rules, like allowing high yield, won’t have a big impact. However, expanding the opportunity set to public equity would significantly enhance flexibility, reduce required return targets for the legacy assets and maximize the probability of success.
Detailed Discussion of Plan A Simulated Results
- A1: Baseline – We start with average Taft-Hartley allocation and a diversified investment-grade SFA portfolio. All assets are expected to deplete by 2046. There is only a 38% chance of making it to 2051 and roughly 20% chance of paying all benefits. However, the SFA is expected to last almost 9 years before any cash outflows are needed from the legacy portfolio. This leaves plenty of room to add illiquid alternatives.
- A2: Replace Legacy Bonds with Public Equity & Alternatives – Given the large allocation to bonds in the SFA and dearth of near-term liquidity needs from the legacy assets, the plan can offload its 20% legacy core bond allocation without concern. We use this capital to boost public equity (+5%) and alternatives (+15%) across private equity, private credit, real estate and infrastructure equity. Of course, once the SFA is depleted legacy assets will need to reestablish a fixed income portfolio. The improvement in outcomes is meaningful, extending the life of assets by 7 years and doubling the chances of paying all benefits to 38%.
- A3: Allow 20% High Yield in SFA – Allowing up to 20% in high yield and bank loans in the SFA would reflect a modest change to the prevailing restrictions and boost SFA returns by roughly 60bps (refer back to Exhibit F). However, we see the impact on plan health is actually immaterial. The SFA lifetime is extended by a couple months. As a consequence of the heavy outflows from the SFA portfolio (10%+ per year), unless we can meaningfully boost returns the impact will be de minimis.
- A4: Maximize Legacy Asset Risk: The required returns needed to pay all benefits are unavailable in beta-only space based on our LTCMA. For this iteration we create a maximum risk/return portfolio, assuming that 50% of legacy assets is the most that could be reasonably put to work in private assets5. For simplicity, we allocate the illiquidity budget to private equity and the remaining 50% in public equity. This adds an incremental 50bps of expected return to the legacy assets and improves chances of paying all benefits to 46%. So even with this extreme portfolio change, there is still a less than even chance of survival.
- A5: 100bps of Legacy Portfolios Alpha: We believe 100bps of alpha on the legacy portfolio is achievable, especially given the large allocation to private markets where wide return dispersion means manager selection can make a consequential contribution to excess returns. This iteration finally gets up above 50%, bringing survival chances to 59%.
- A6: Allow Public Equity in SFA – By expanding the SFA to allow all liquid public market assets, the flexibility to achieve required returns is significantly improved. A higher returning SFA means the legacy portfolio doesn’t have to stretch as far out the risk curve to hit required returns. This last step brings the survival probability to 62% – not 100% but a more than 3x improvement relative to the baseline scenario.
We’ve run similar exercises for our other two archetypal plans with details available in the appendix. The insights are similar but survival probabilities are lower at each step due to the larger size of the SFA.
Exhibit J: Simulated Results for Plan A by Varying SFA and Legacy Asset Portfolios
To have at least a 50% chance of survival, legacy portfolios must significantly increase allocations to return-maximizing alternatives and generate alpha
Source: JPMorgan Calculations.
Conclusion
The analysis we’ve outlined in this paper will vary across plans based on their unique cash flow profiles and actuarial assumptions. However, we think the takeaways will hold for both plan sponsors and lawmakers. In order to have a decent shot at long-term solvency, legacy asset pools will need to meaningfully increase returns. Larger allocations to illiquid private market assets and alpha generation through active management are both crucial levers. While marginal changes to the SFA investment restrictions, like adding high yield, will have little impact, allowing public equities will greatly enhance flexibility to achieve required returns.
We also believe it is imperative to have a strategic framework in place for investing both legacy and SFA asset pools. As returns and demographic experience are realized, and especially as legislation is updated, the optimal investment solution will certainly evolve. And importantly, these are all linked. Higher earnings on SFA funds will extend the life of the pool and enhance the illiquidity budget of legacy assets while simultaneously reducing their return needs. The opposite will be true when SFA assets underperform. We have tackled this complex ecosystem through a required return framework. This gives the plan an aim to work toward and as facts on the ground change, the required return will evolve and the investment strategy can transform along with it. The task assigned to the truck driver is already difficult enough. It becomes all the more challenging if he doesn’t know what direction he’s supposed to be driving.
APPENDIX
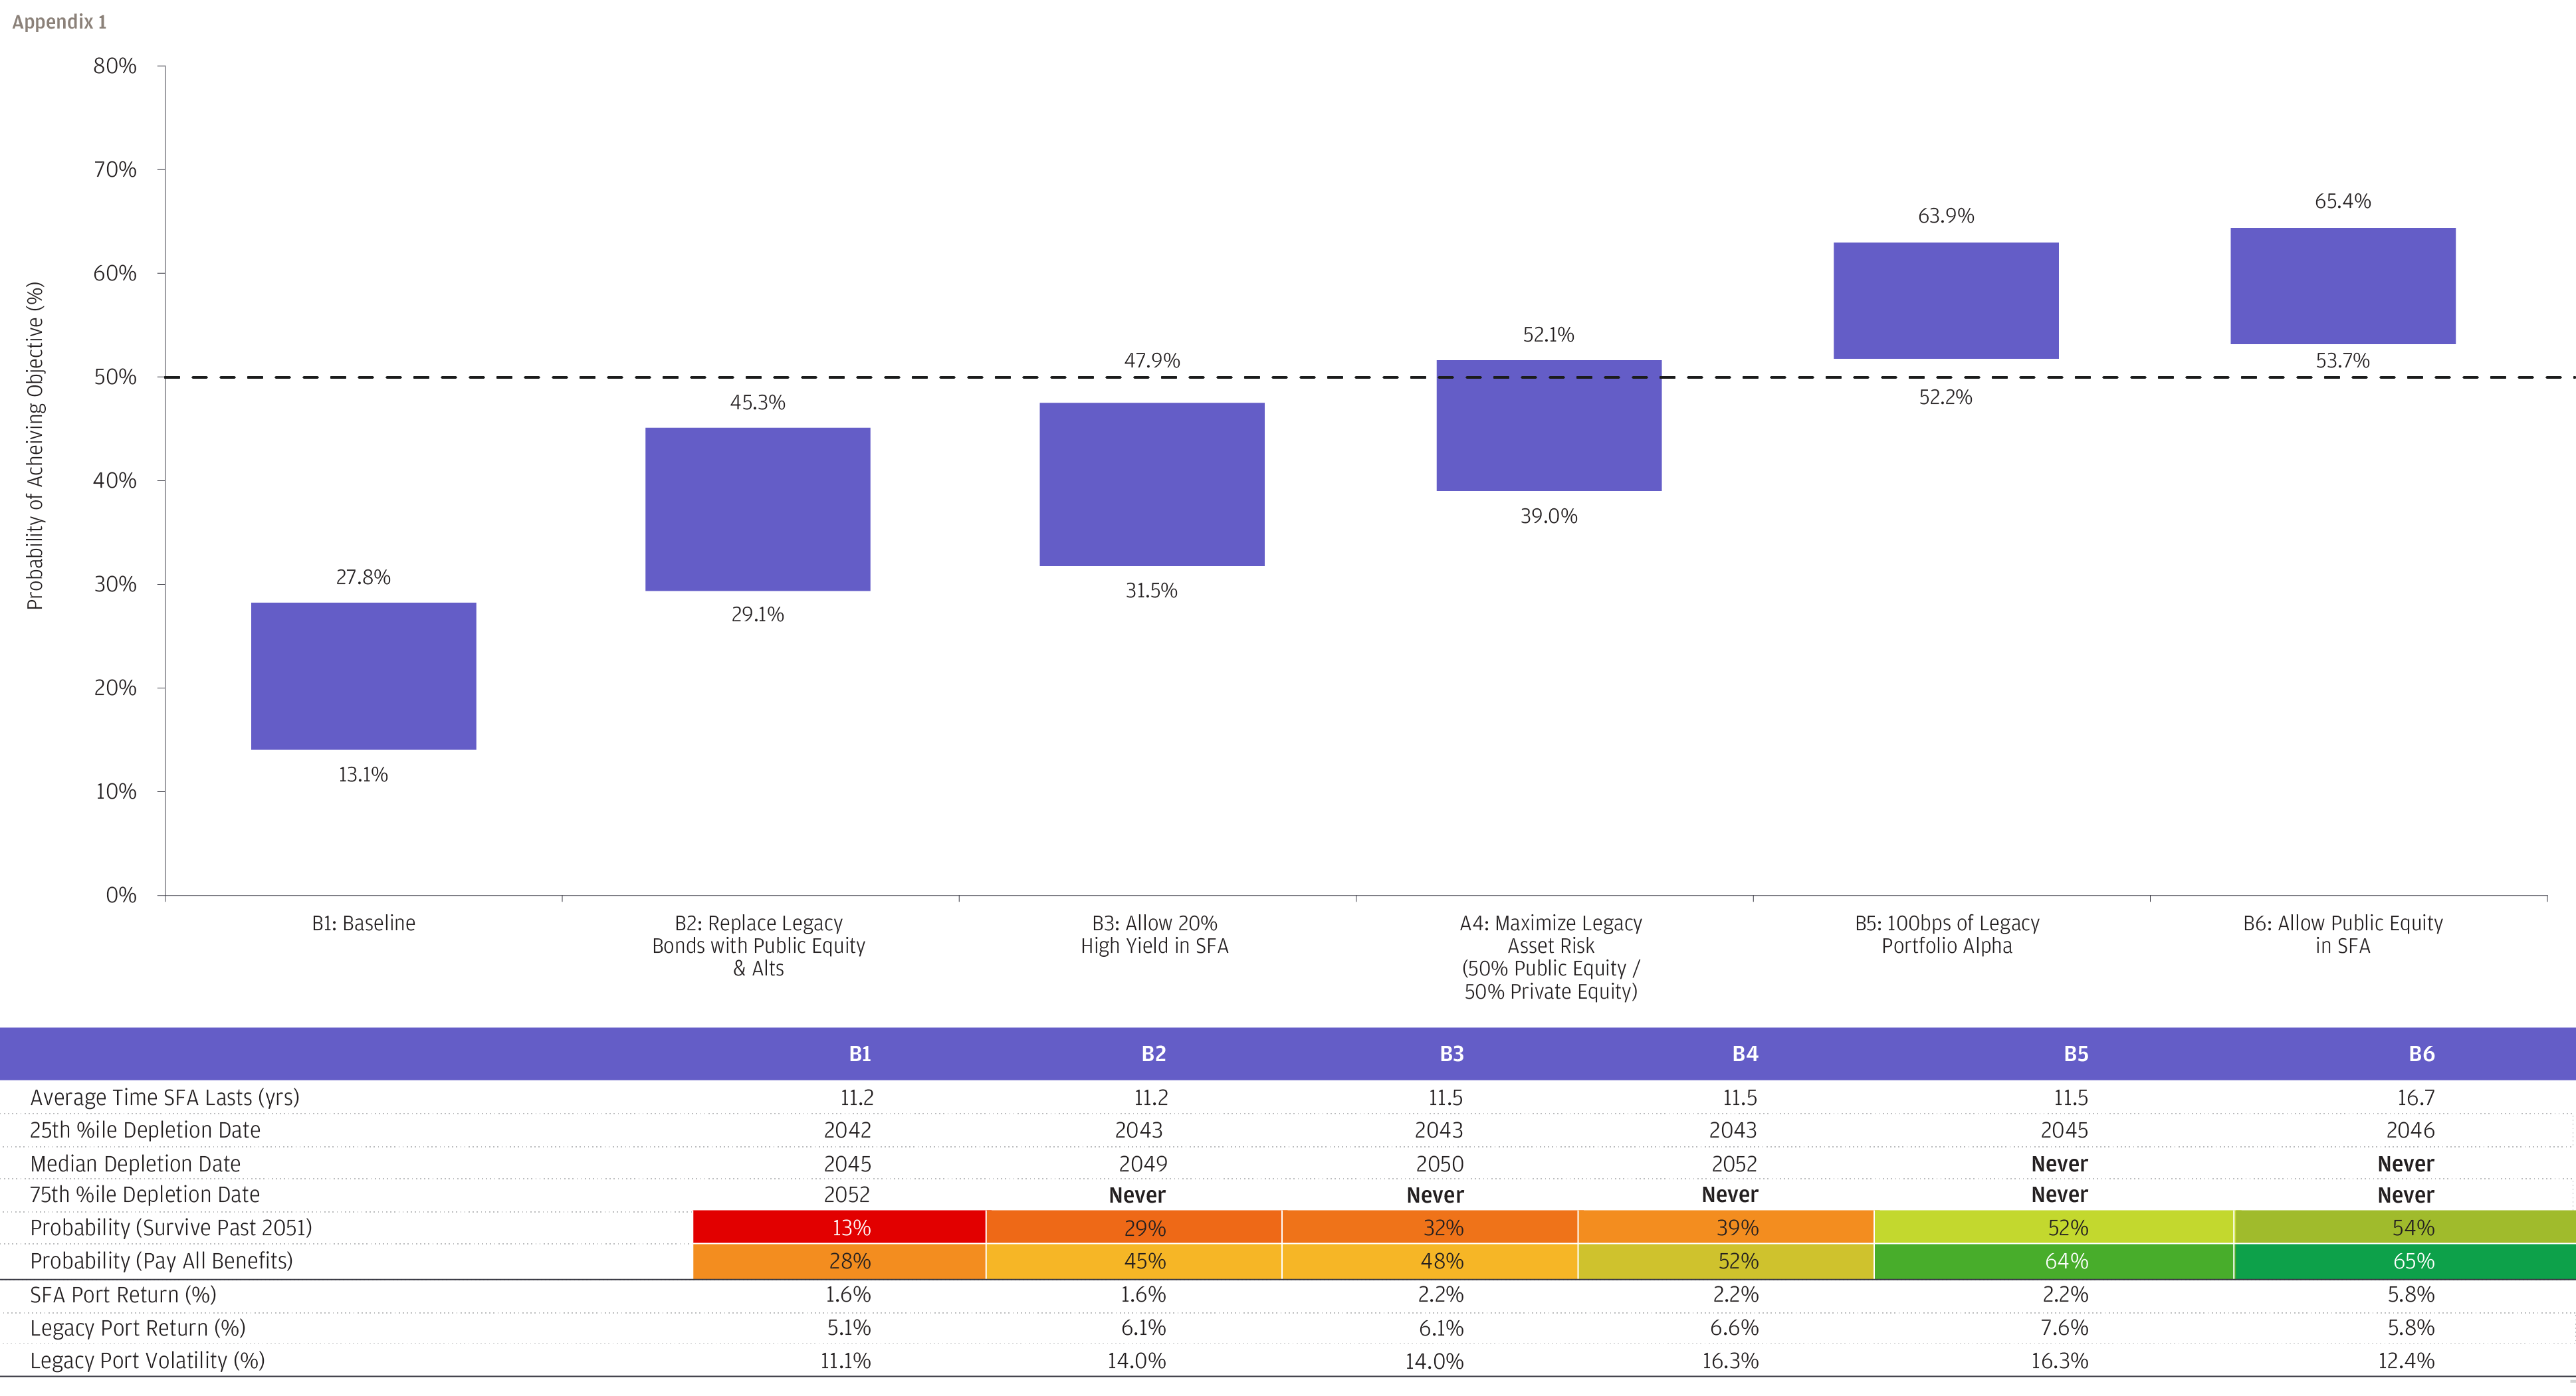
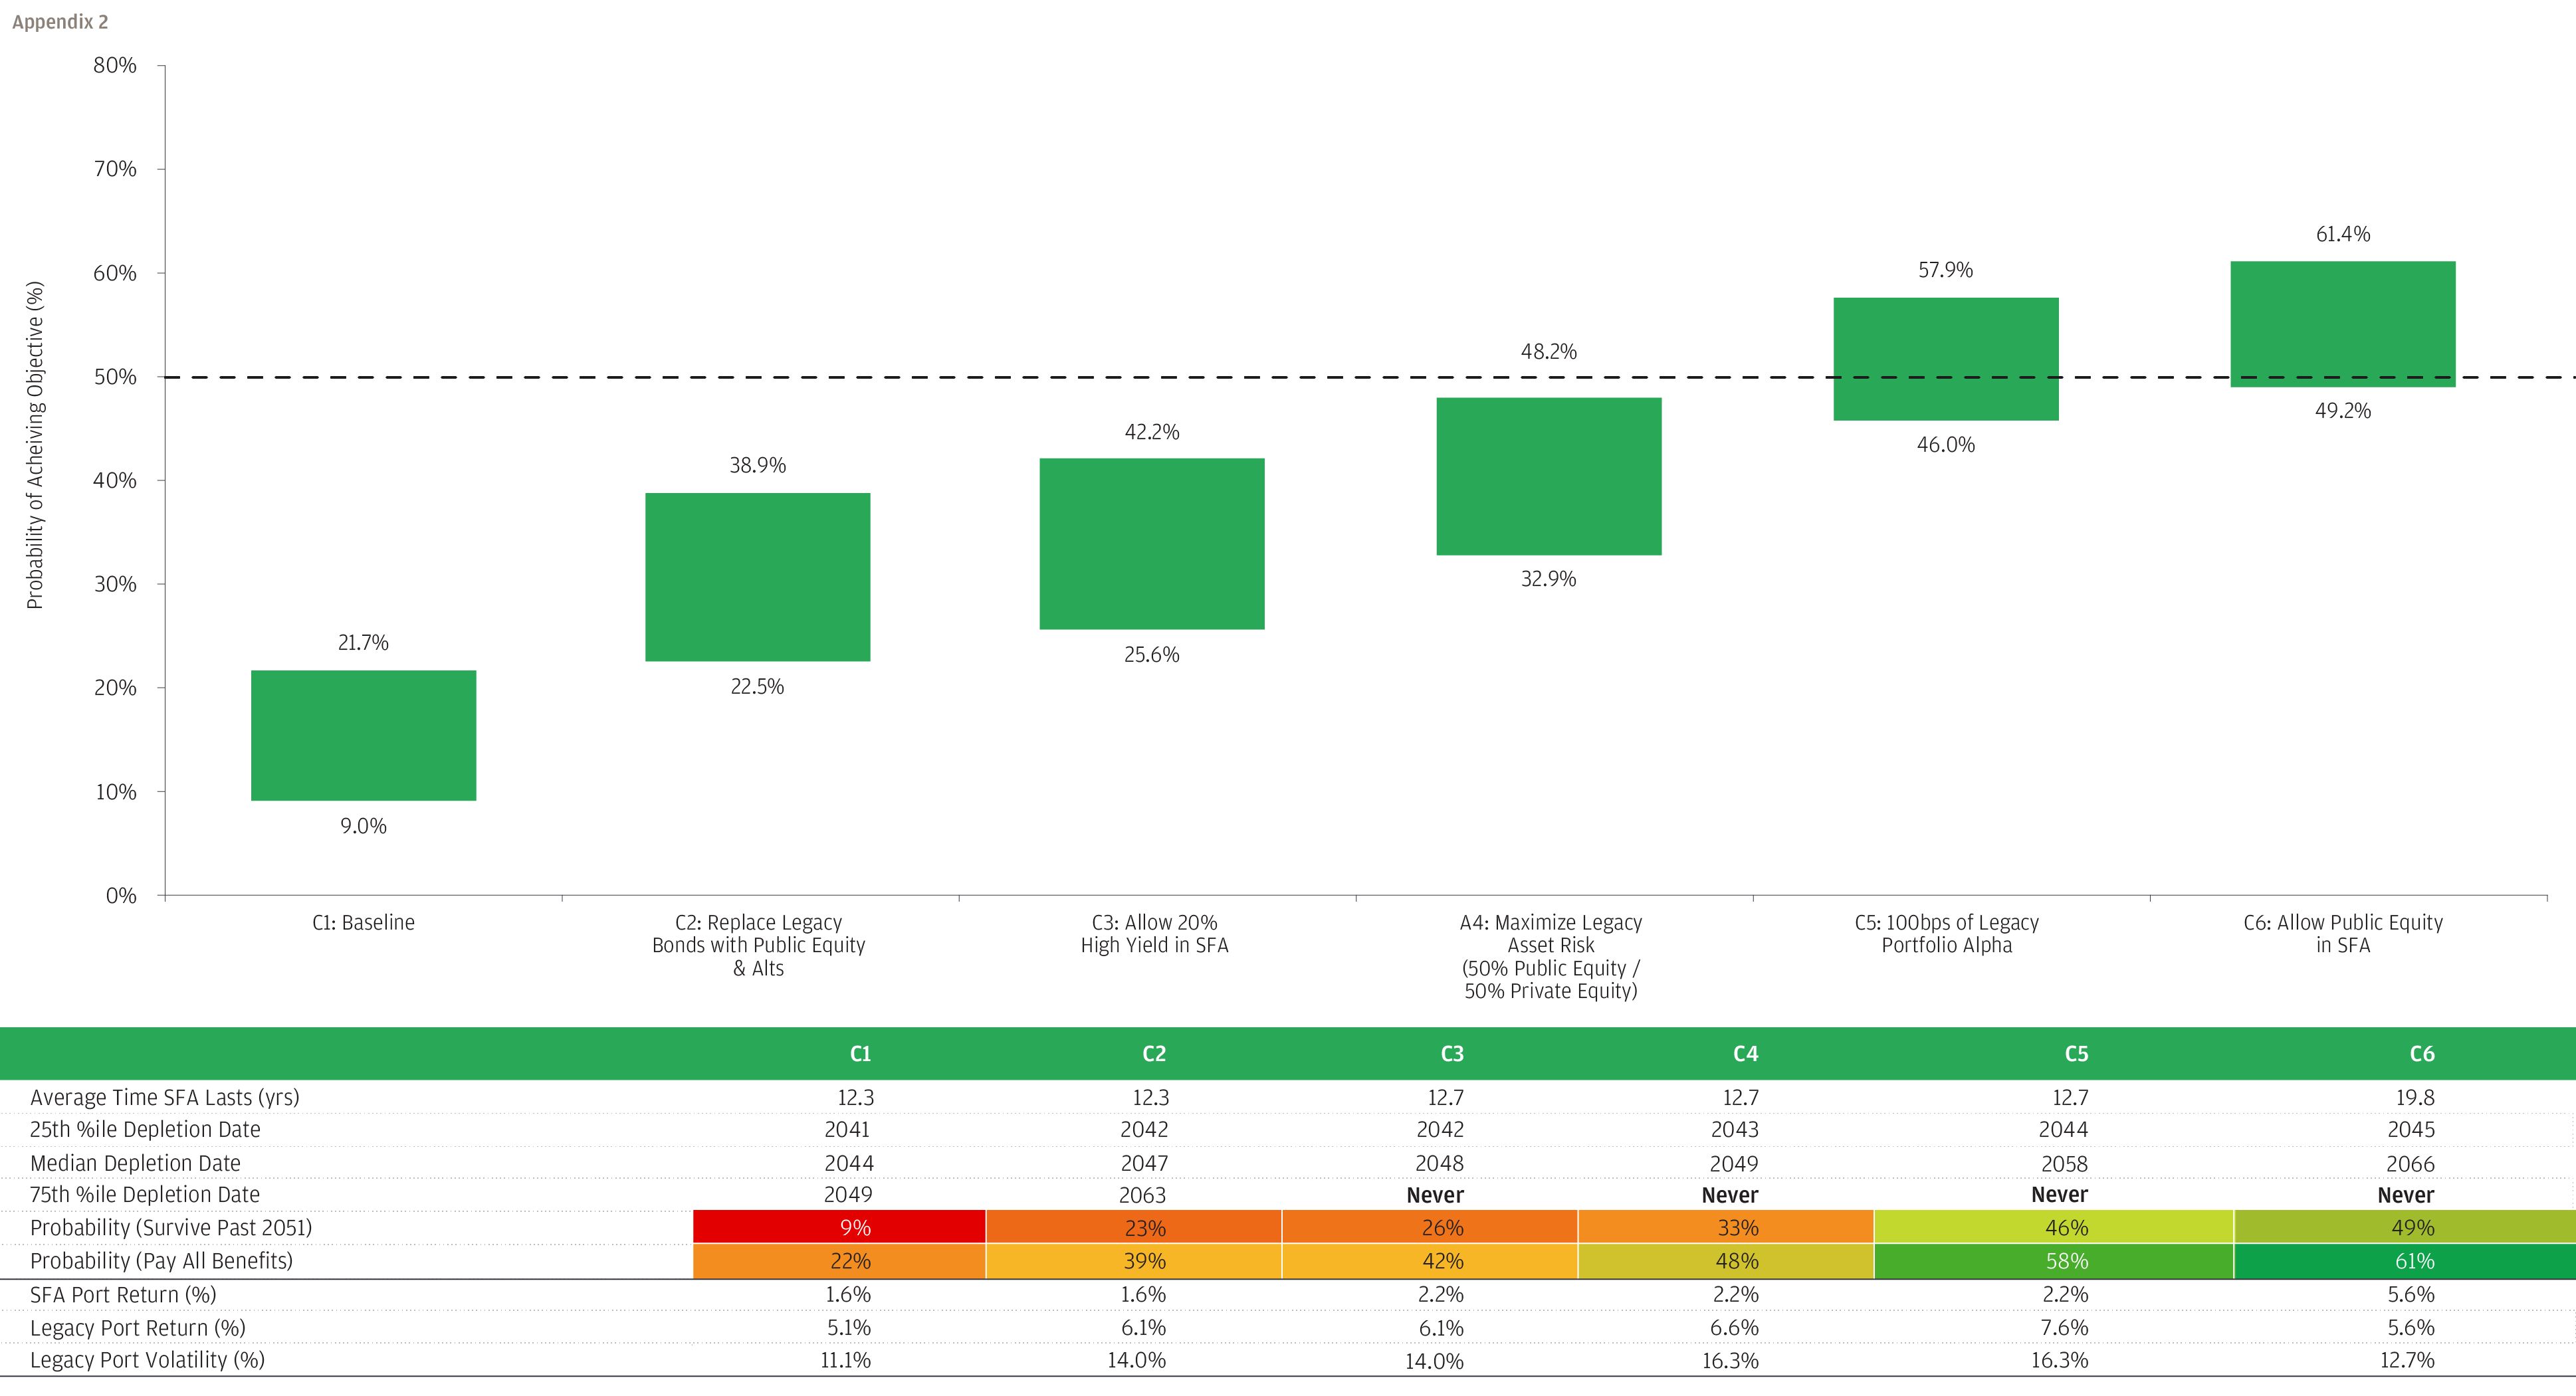
Here we expand the results of Exhibit J to our two other archetypal plans with larger SFA fund allocations relative to existing assets. The main takeaways are identical, although as the relative size of the SFA grows, the more difficult it becomes to maintain solvency.
Plan B: Simulated Results for Plan B by Varying SFA and Legacy Asset Portfolios
Plan C: Simulated Results for Plan C by Varying SFA and Legacy Asset Portfolios
1 The rate can correspond to the month the plan’s application is filed or use a lookback of up to three months.
2 Importantly, for those plans using a discount rate below the interest rate limit, the investment problem will be relatively easier to solve. However, for these plans maintaining solvency will not be without its challenges.
3 We also acknowledge that many plans that need assistance may not even be eligible under the criteria prescribed by ARPA. However, for this paper we focus on investment implications of the current rules.
4 Based on JPMorgan’s Long-Term Capital Market Assumptions (LTCMA).
5 For simplicity, we’ve assumed the entire alternatives allocation is in private equity. Each plan will have its own initial conditions, and it would not be prudent to liquidate existing private market allocations. In practice, this allocation would reflect a mix of assets across private equity, private credit and real assets. The more diversified the portfolio across exposures and vehicle types, the more likely an allocation greater than 50% could be achieved.
6 In fact, it encompasses yields from 20 through 100 years, most of them projected rather than observed.
7 The weighted average life (WAL) measures ignores discounting and therefore the duration of SFA funds will be even lower.