Corporate pension allocation changes
A preliminary analysis
01/29/2020
Michael Buchenholz
In the Rorschach test, subjects are shown images of inkblots and their perceptions are recorded by examiners to infer emotional and personality characteristics. Reactions to pension performance this past year serve as a form of pension Rorschach test. Those with a total return perspective will be ecstatic, as they will see their plans were able to outearn their expected return assumptions, by large margins in some cases. Those with a liability aware perspective will look at the same picture and be sorely disappointed as outsized liability growth overpowers strong asset returns.
While most plan sponsors’ 10-k filings won’t be available until late February, we find it useful for plan sponsors to analyze preliminary pension data from those sponsors with non-calendar fiscal years to get an early indication of industry funded status trends and allocation changes. Specifically, we look at corporate pension plans with fiscal year-ends between May and October of 2019
EXHIBIT 1: CHANGE IN ALLOCATION OVER THE FISCAL YEAR
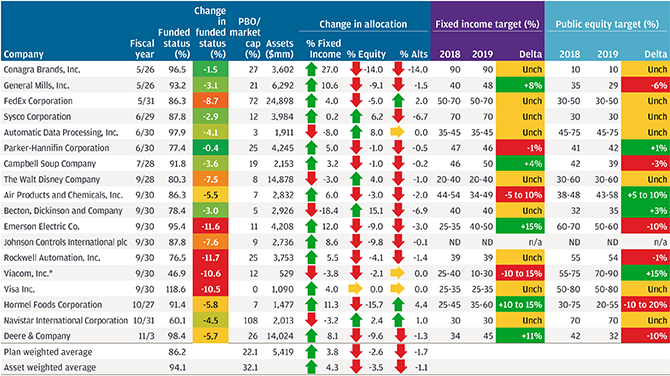
Source: Capital IQ, 10-K Filings, Bloomberg as of market close on January 4, 2019.
*Subsequently part of ViacomCBS, Inc.
ND = Not Disclosed, NA = Not Applicable, Unch = Unchanged. Funded status based on U.S. plans only where data is available.
Given the positive, and in some cases outsized, asset returns, it seems odd that every plan we analyzed experienced a drop in funded status over the fiscal year. For the majority of plans, falling discount rates had the largest impact on funded status. EXHIBIT 3 provides a decomposition of the sources of change in funded status for each plan analyzed. The green bars measuring the “actuarial (gain)/loss” capture this discount rate effect as well as the impact of any other liability actuarial assumption changes. The circum- stances are reminiscent of 2014 where we saw most plans give back funded status gains of the prior year due to falling rates, despite strong performance in U.S. Equities (+13.7% over the calendar year and significantly outperforming International Equities). Those with 9/30 fiscal years tended to fare the worst, due to a combination of larger discount rate dips (the 10yr treasury yield fell 140bps over the fiscal year) and a higher starting point for equities prior to the pullback we saw in Q4 of 2018. In contrast, plans with 10/31 and later fiscal year-ends generally experienced double-digit annual returns thanks to lower starting equity valuations.
EXHIBIT 2: ONE-YEAR TOTAL RETURNS
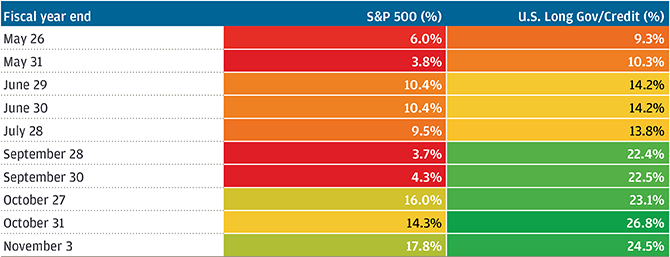
Source: Capital IQ, 10-K Filings, Bloomberg as of market close on January 4, 2020.
Despite the parallel funded status decreases, asset allocation changes were mixed against an overall continued derisking trend. On an asset weighted basis, the aggregate allocations to fixed income increased around 4%, largely funded from public equity but with moderate reduction in alternatives. It is almost certain that some of the derisking trend is attributable to market movements rather than pure re-allocations (long duration fixed income outperformed U.S. Equity across almost every fiscal year) and we see multiple cases where a plan substituted bonds for public equity against an unchanged target allocation.
In March of this year, we plan to release our annual corporate pen- sion peer analysis where we will further detail funded status trends and analyze 2019 calendar year performance. This comprehensive report will highlight historical findings and explore how corporate pension plans can more holistically manage risk across multiple dimensions (investments, funding, risk transfer and plan design) in the years to come, drawing on data from the largest 100 plans by assets and insights from our engagements with J.P. Morgan clients.
EXHIBIT 3: CHANGE IN FUNDED STATUS OVER FISCAL YEAR
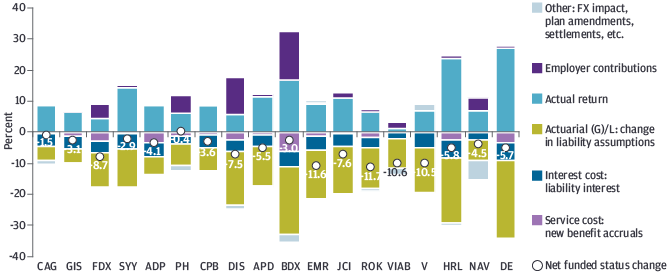
Source: Capital IQ, 10-K Filings, JPMorgan Asset Management; data as of January 4, 2020.
0903c02a824a60d8