Slide Image

Chart Image

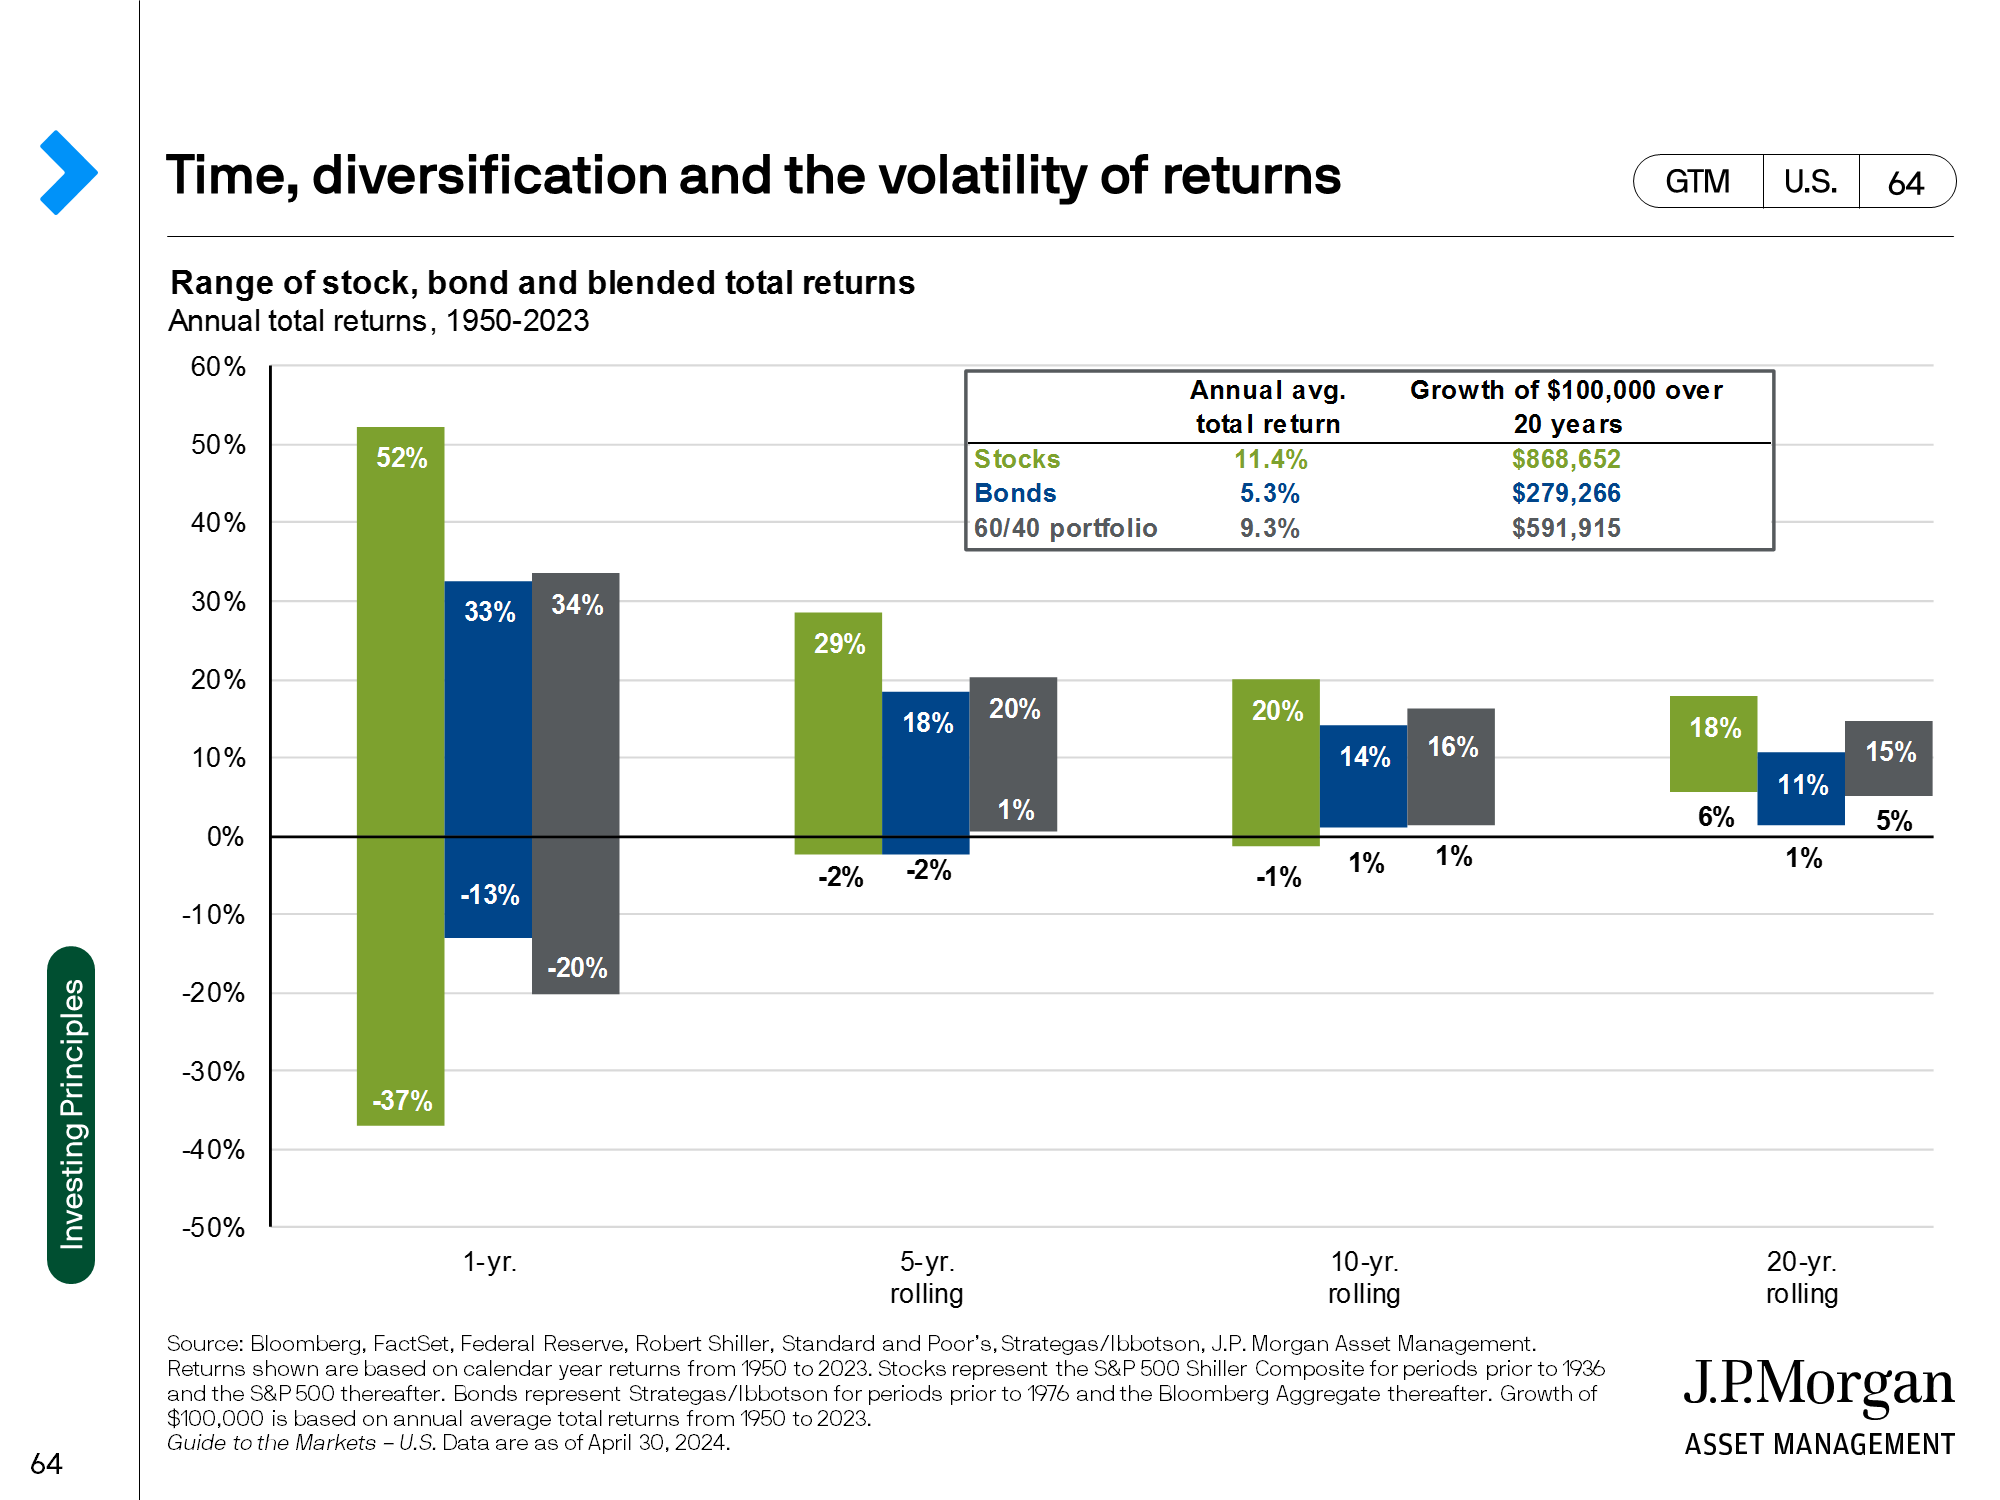
60/40 annual returns
This page looks at the total return of a 60/40 portfolio, or a portfolio comprised of 60% equities – represented by the S&P 500 – and 40% bonds – represented by the Bloomberg U.S. Aggregate Total Return Index – rebalanced annually. The chart goes back to 1950, showing over 70 years worth of data. 2022 was clearly a painful year for investors, but this chart helps to put that pain into perspective. Not only was 2022 among the worst years for a 60/40 portfolio since the mid-1970s, it was also the first time since 1974 that the bond market amplified the pain felt in stocks. In other words, 2022 was an incredibly unusual year for markets.