Slide Image

Chart Image

P/E ratios and equity returns
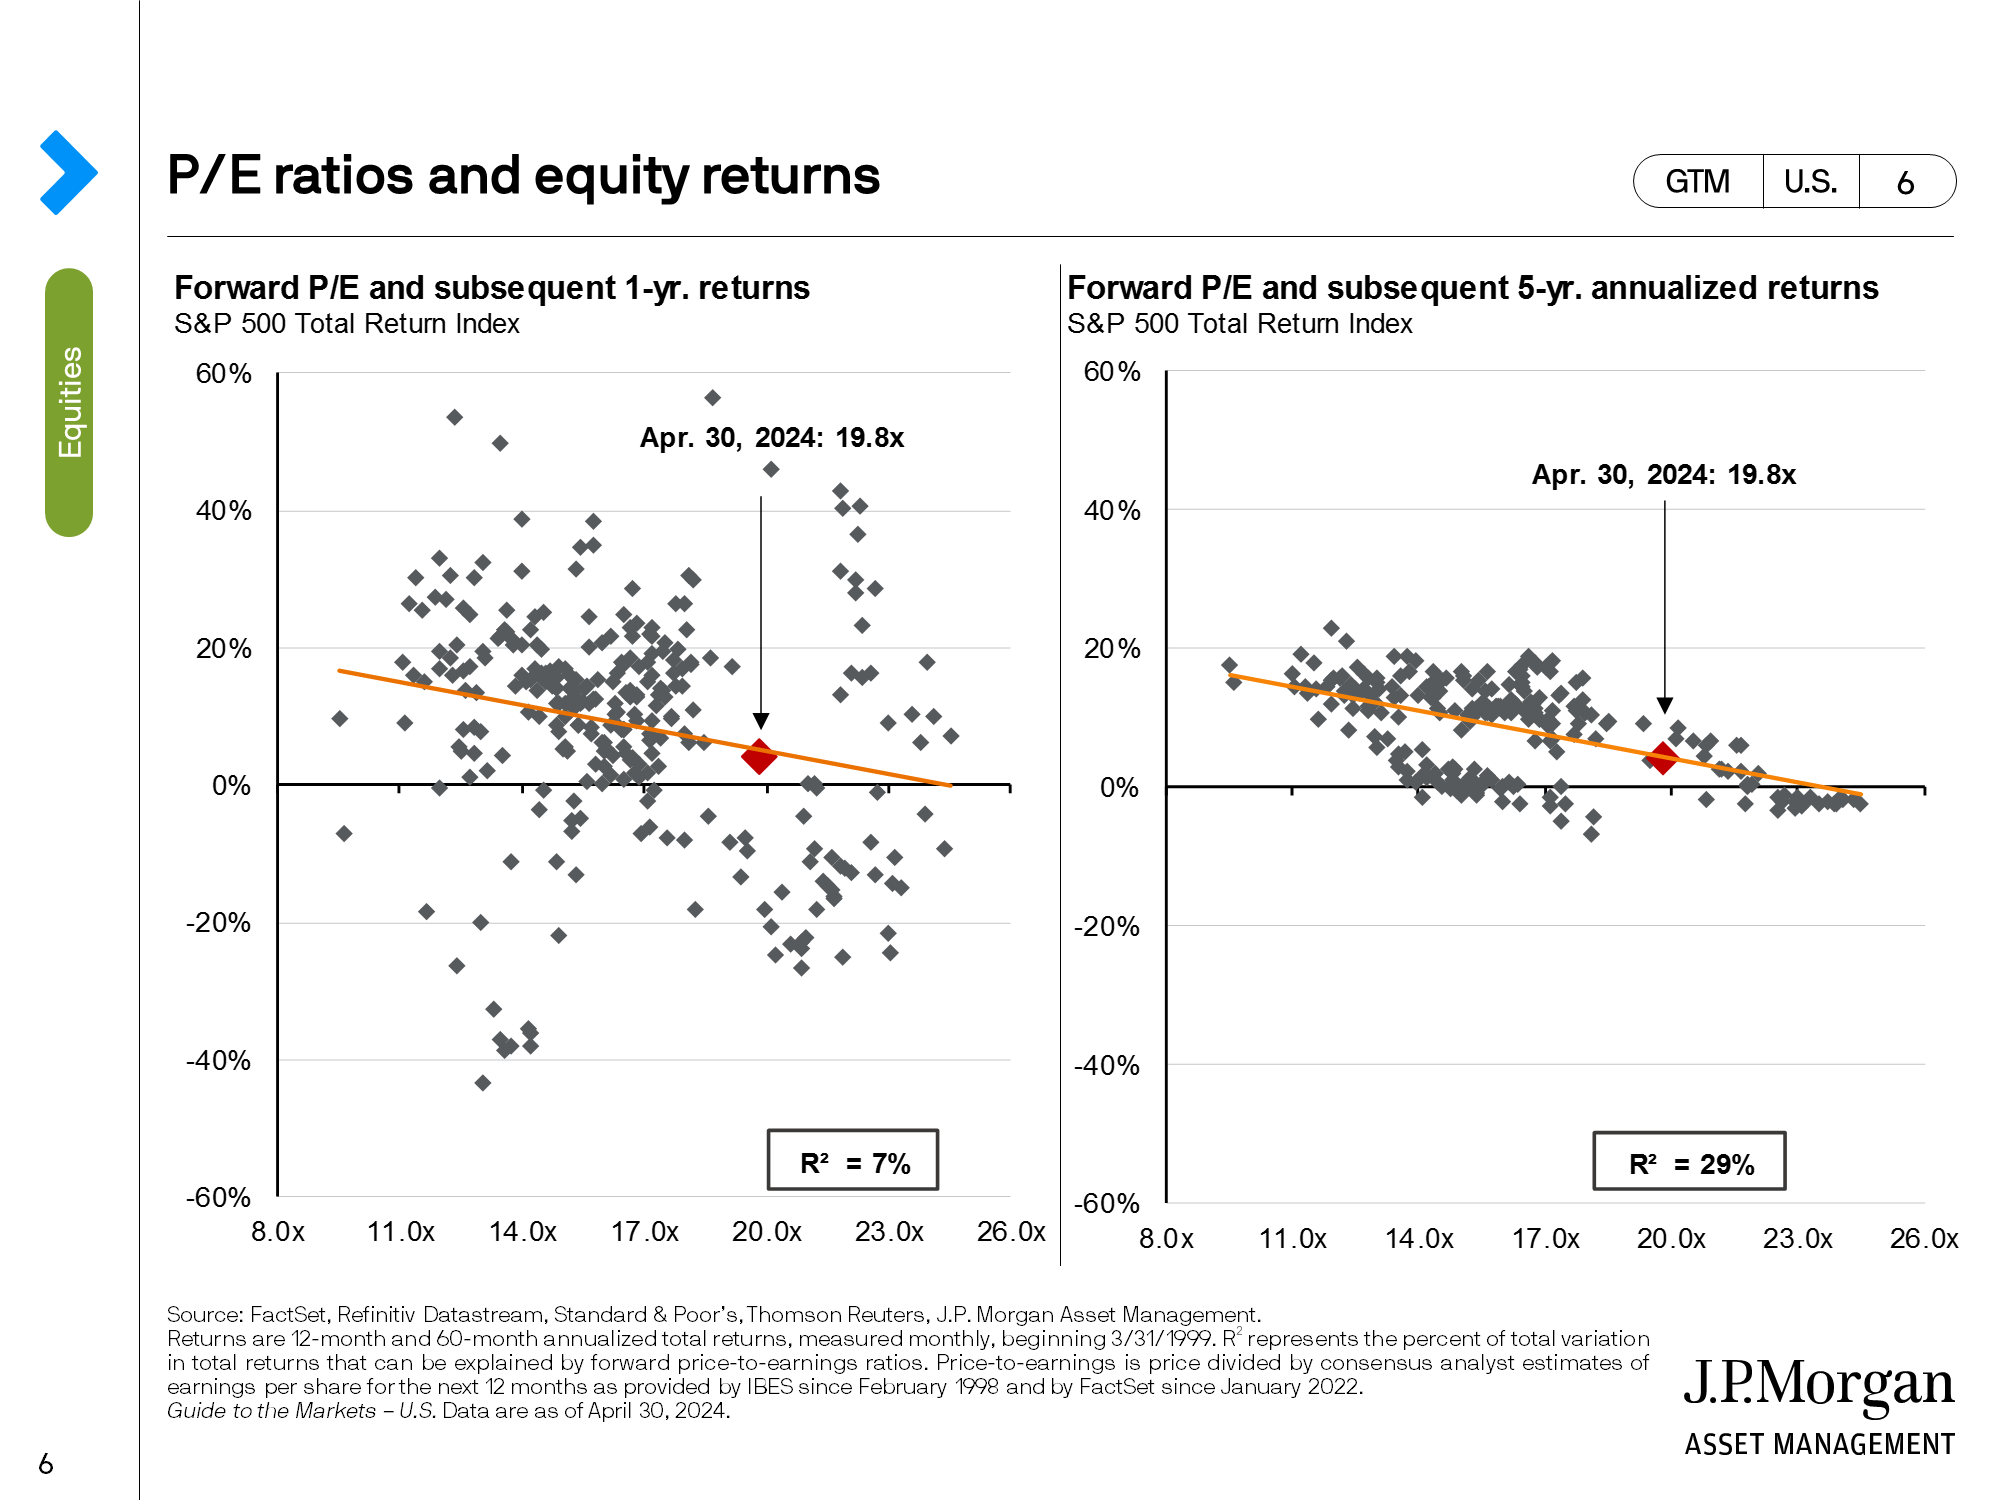
These charts demonstrate the historical relationship between forward P/E levels and subsequent 1 and 5-year returns. This slide shows that while valuation measures, such as the forward P/E, do not necessarily have predicative power in terms of returns over a short time period (1 year), there is a much tighter correlation when using longer return periods, such as 5 years.