Slide Image
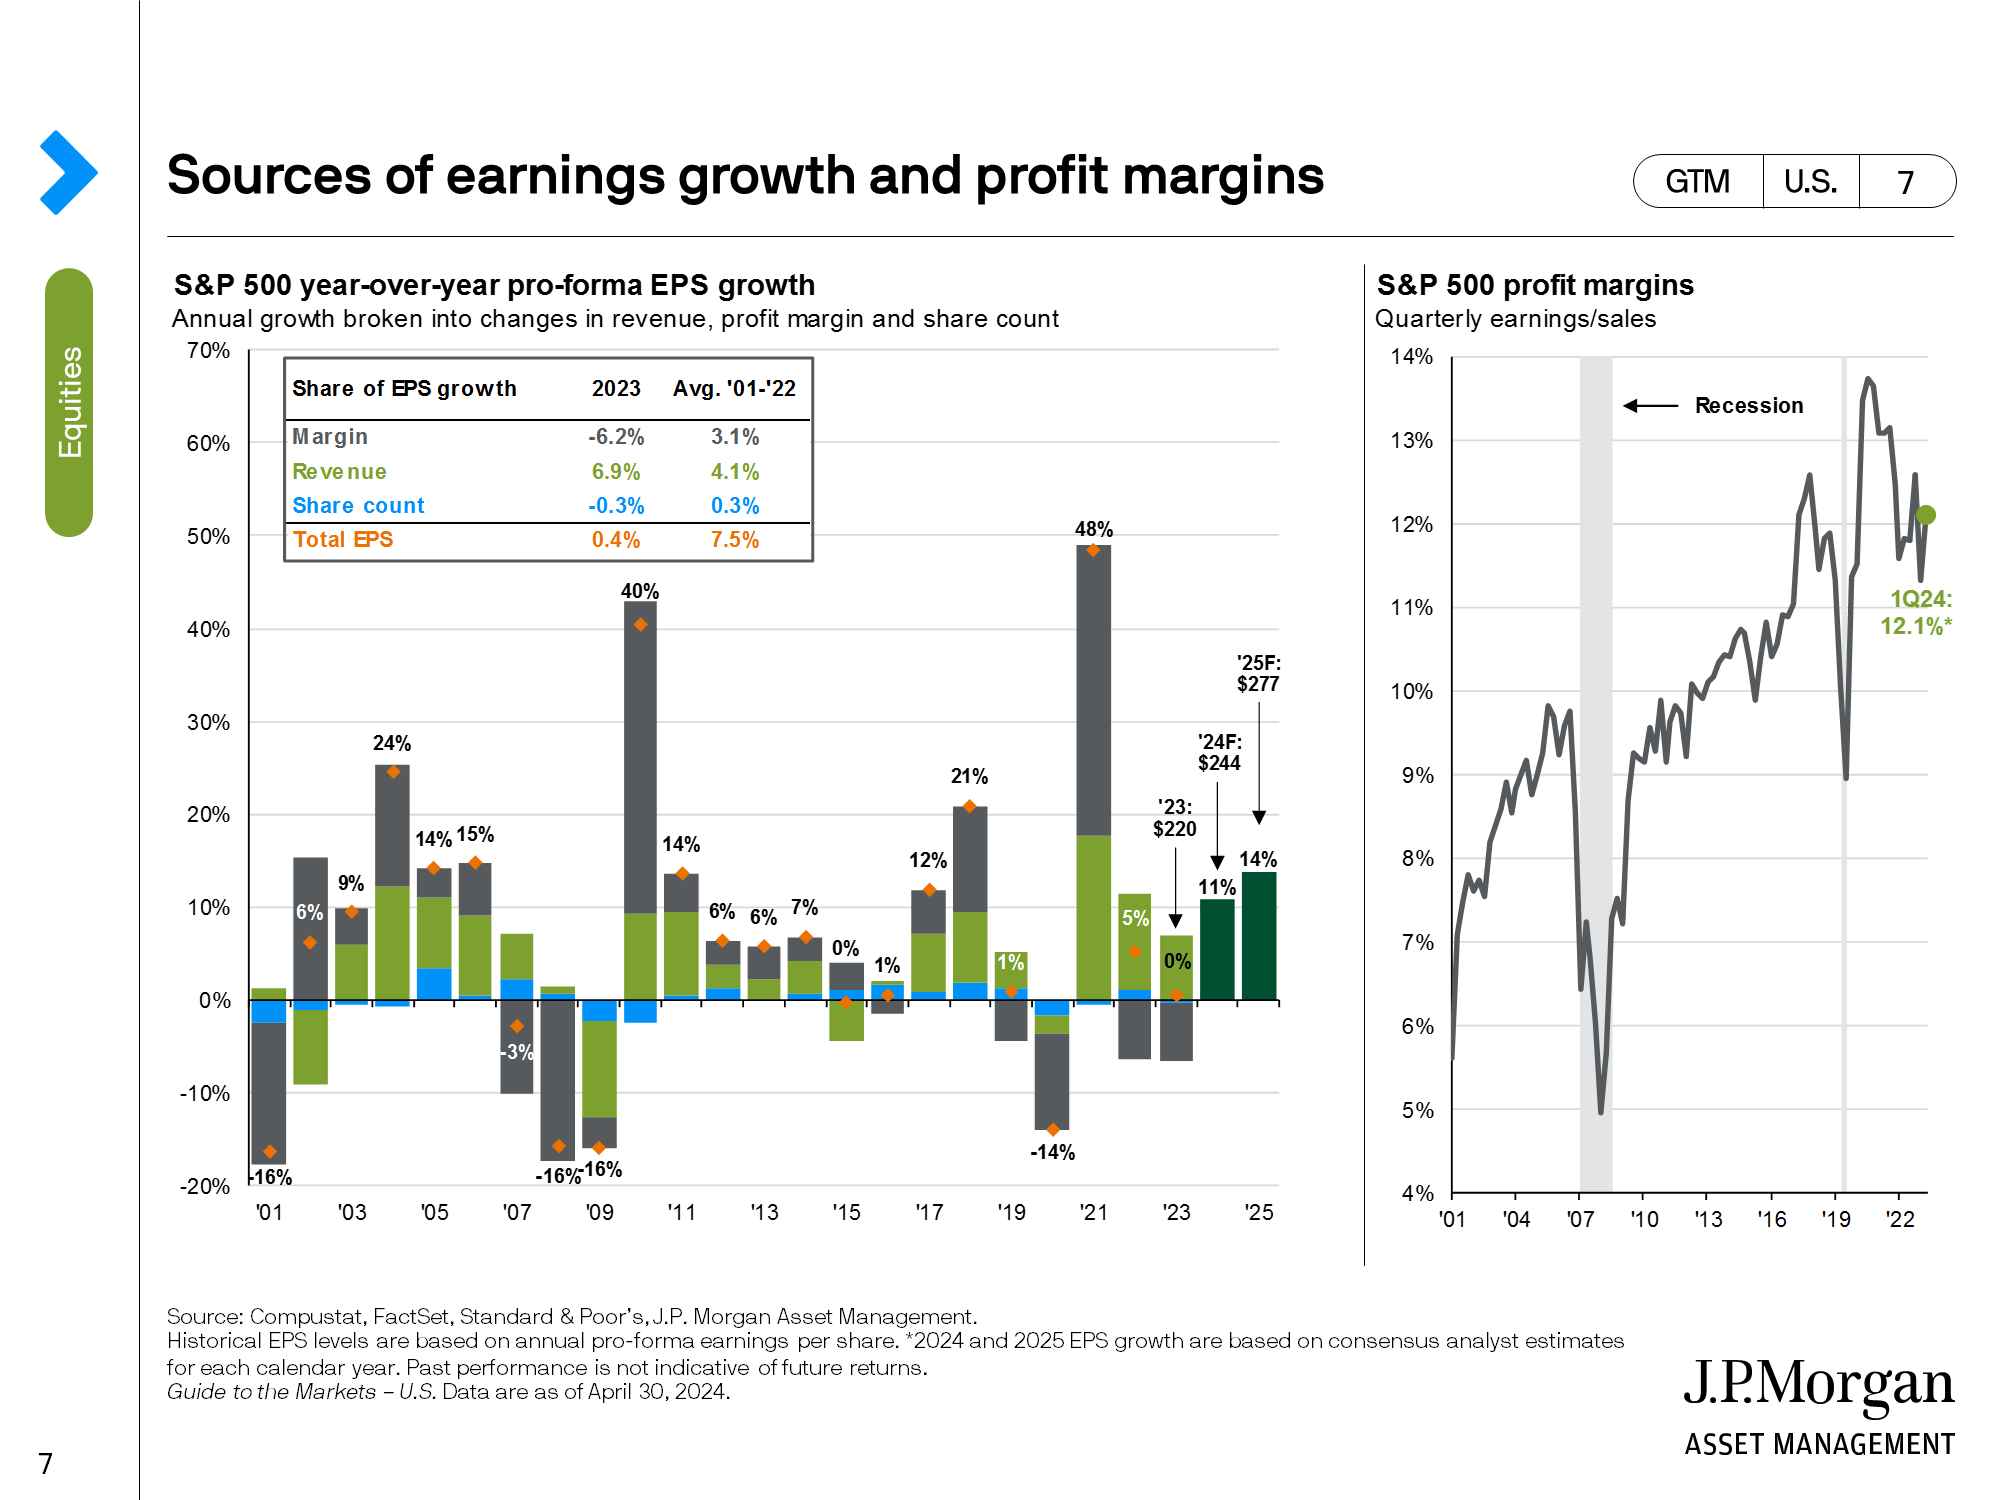
Chart Image
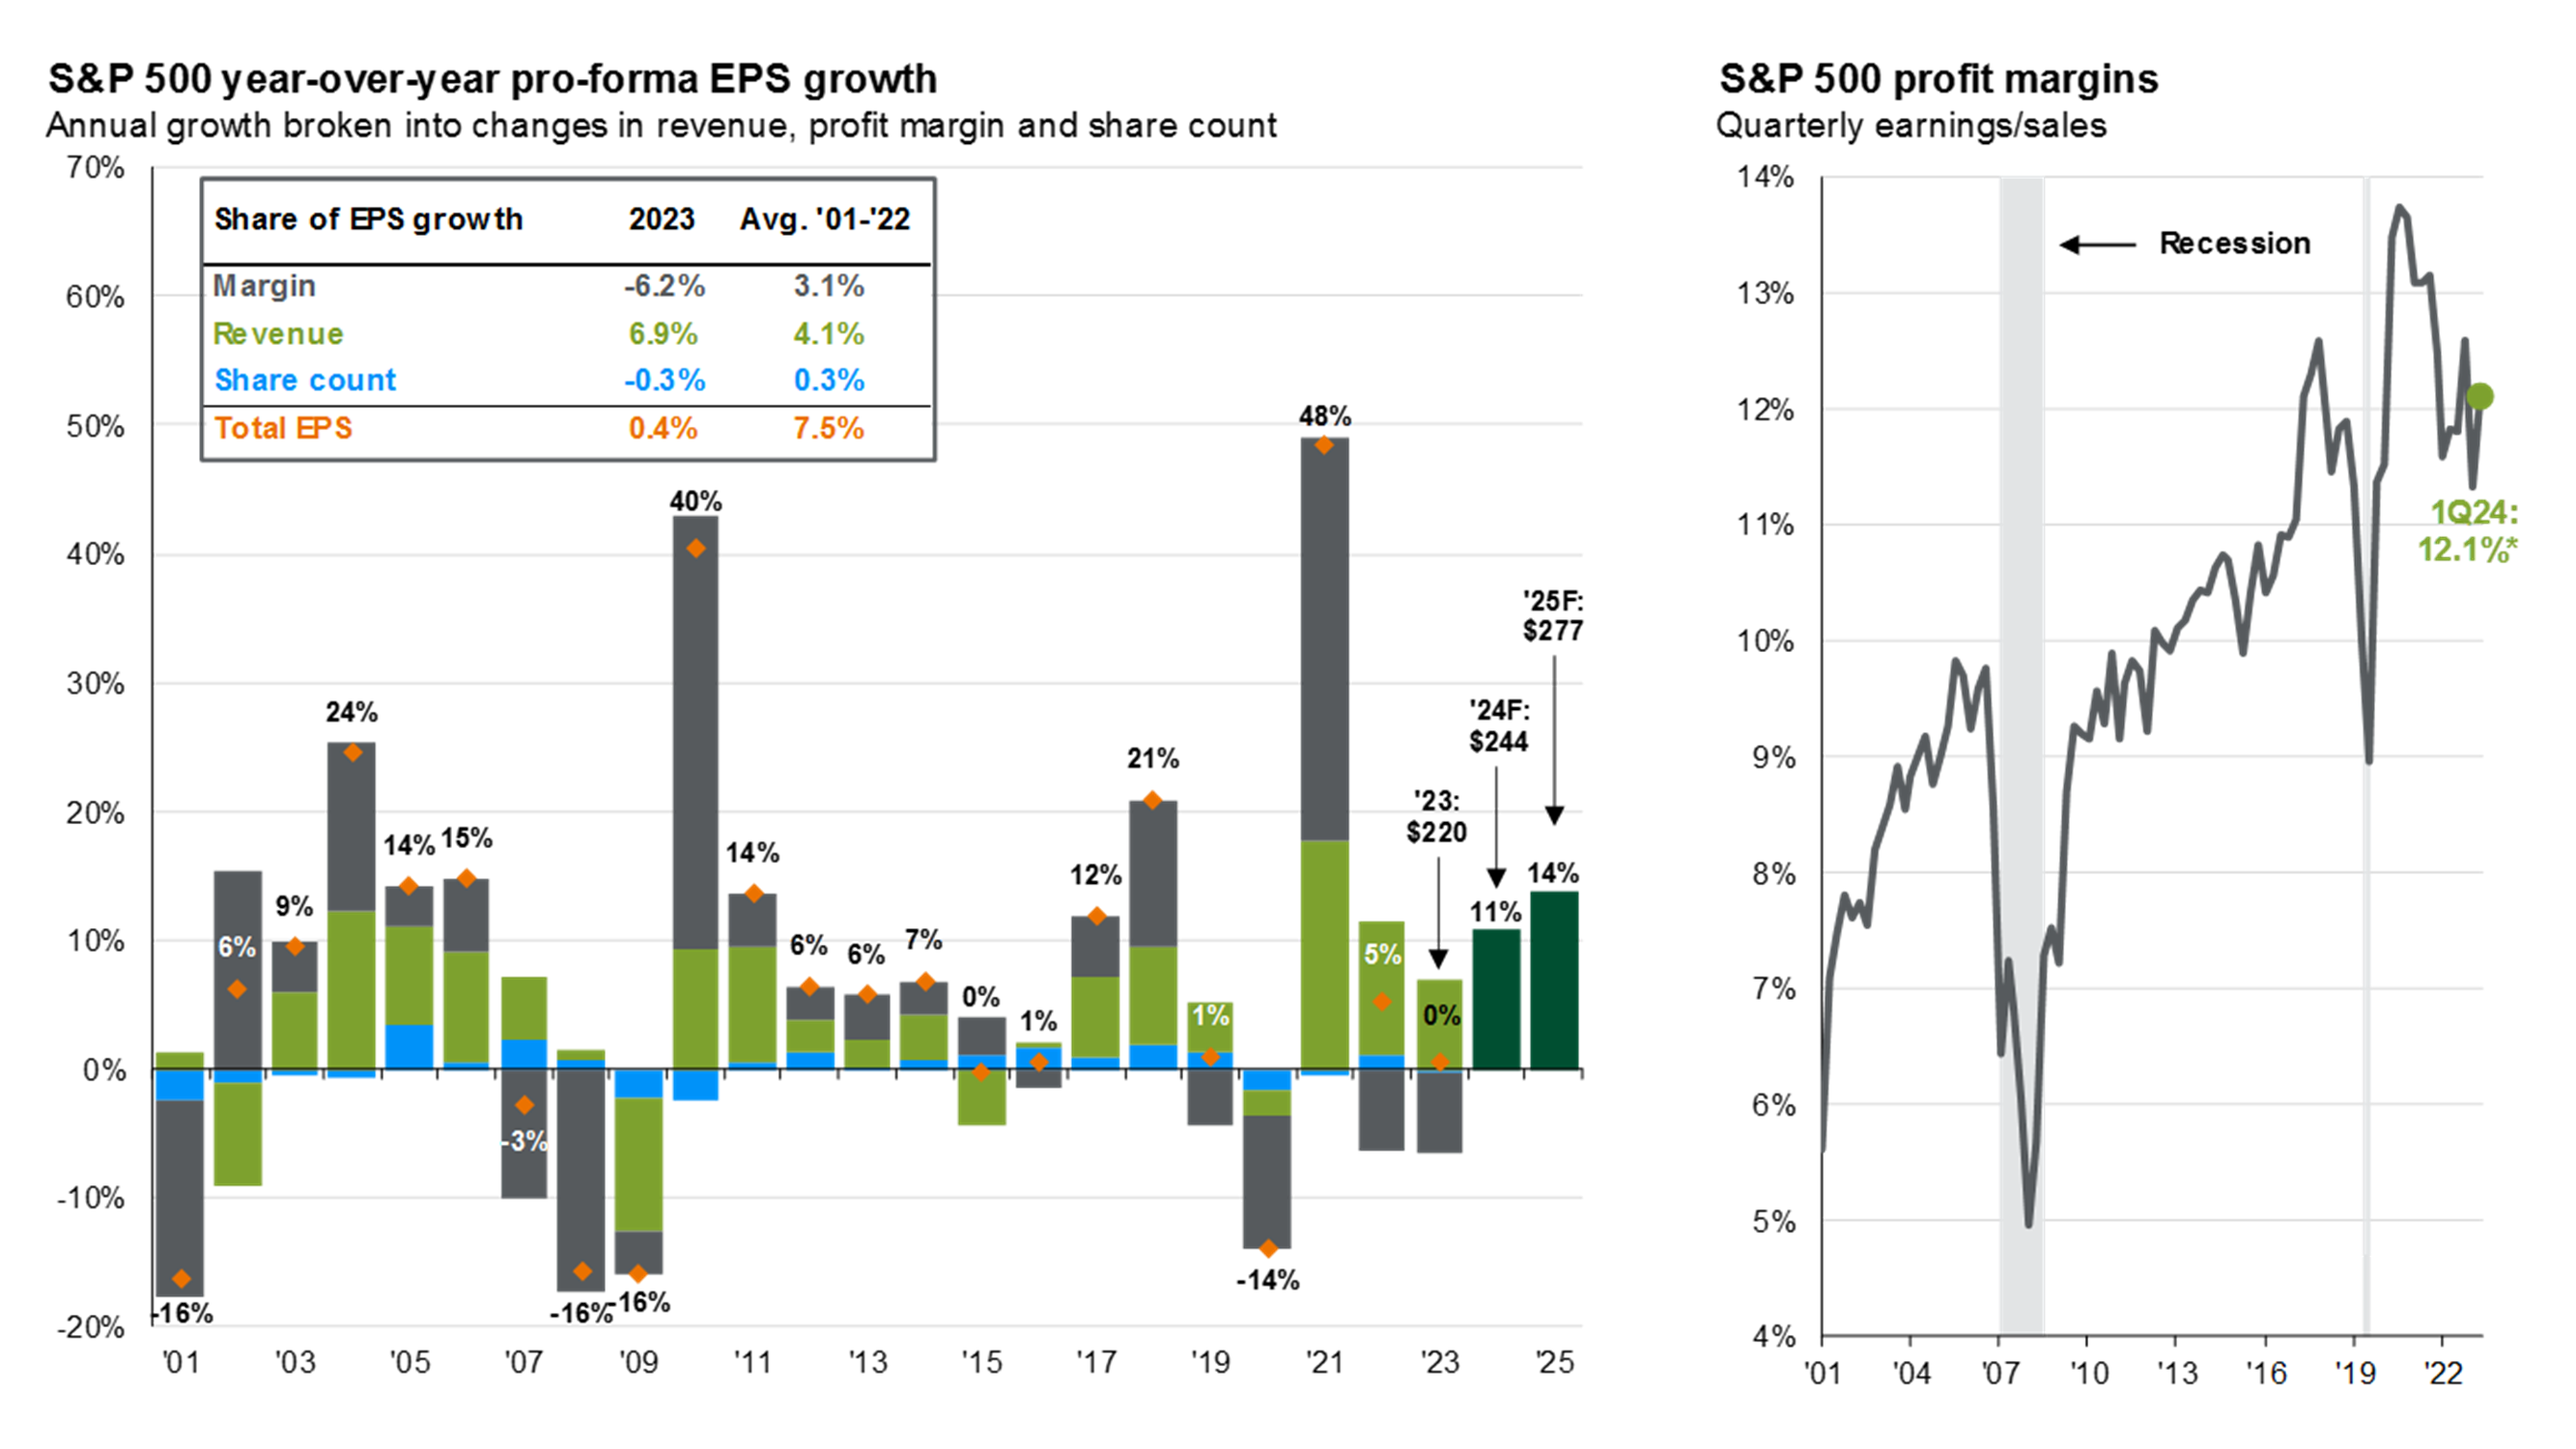
Sources of earnings growth and profit margins
The chart on the left decomposes S&P 500 earnings growth into the contributions from margins, revenues and buybacks. The chart on the left shows quarterly profit margins since 2002, indicating U.S. companies have become more profitable over time.