Slide Image
Chart Image
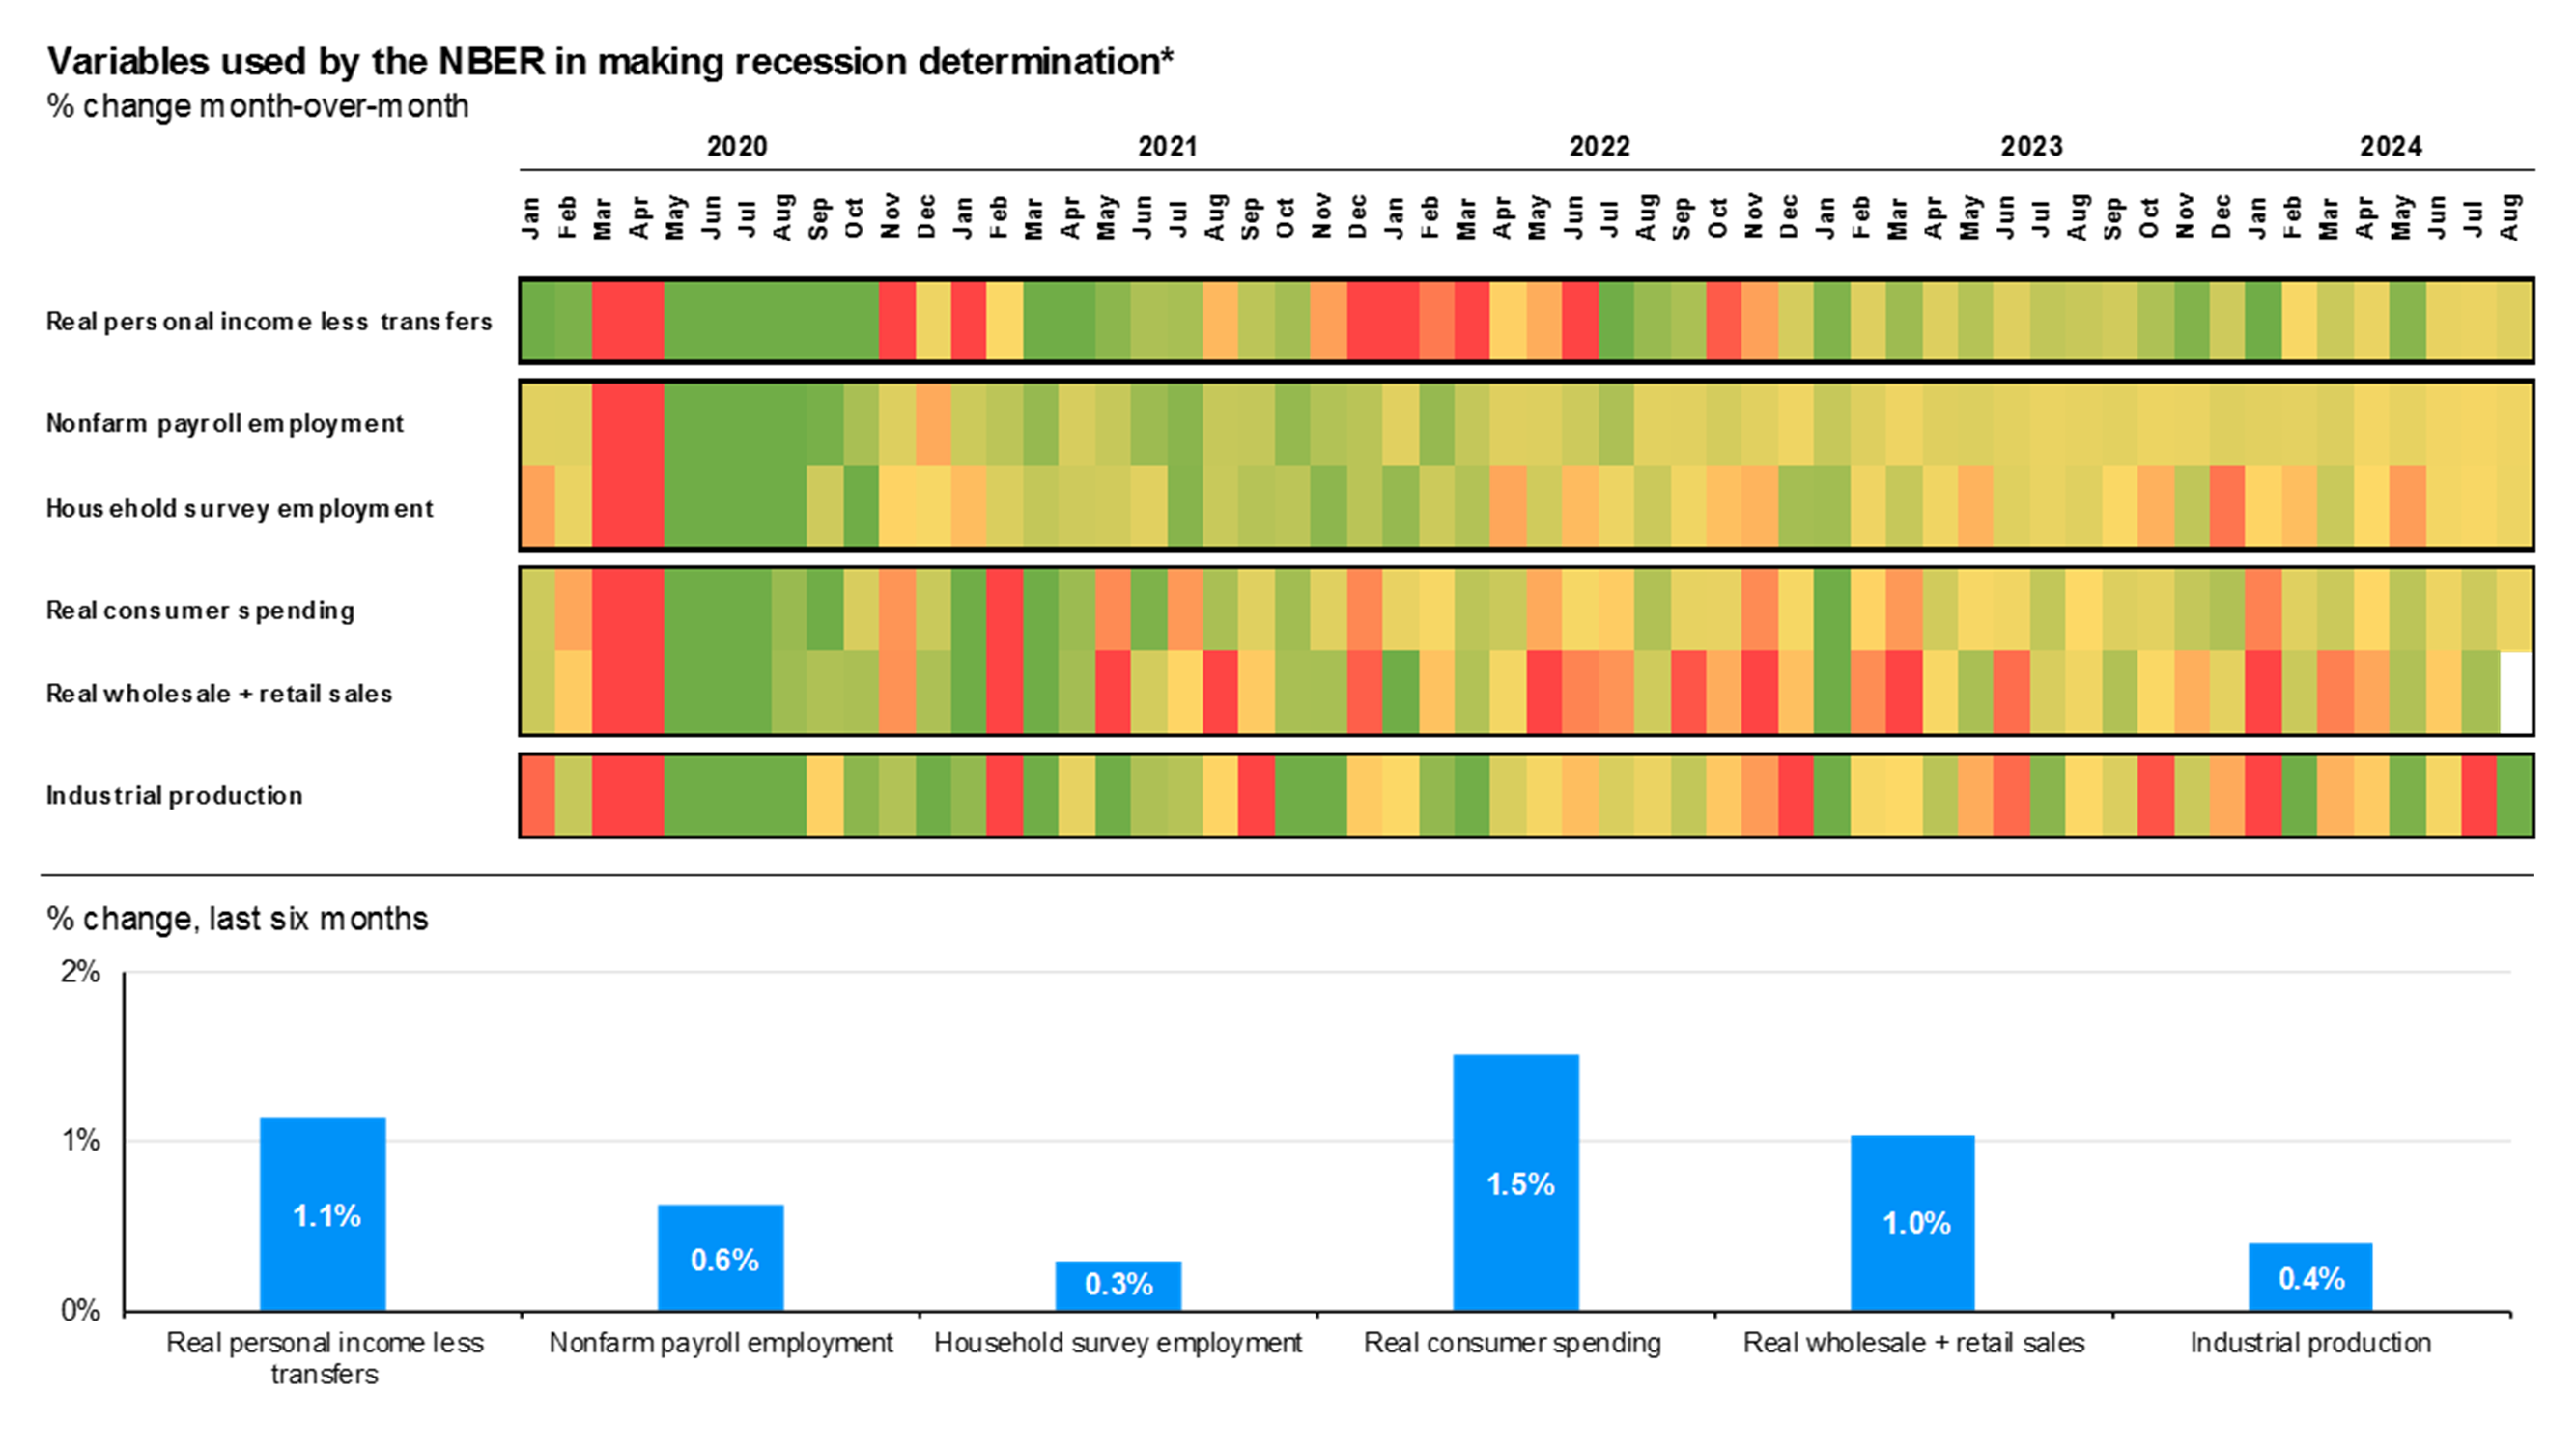
Recession determinants
A common, back-of-the-envelope definition of a recession is two consecutive quarters of negative GDP growth. However, the unofficial scorekeeper of when recessions start and end is the National Bureau of Economic Research (the NBER), and it looks for a broad-based decline in a variety of economic indicators to make their determination. On this slide, we show a heatmap of the economic variables the NBER has listed in its methodology on a monthly basis going back to 2019. Green means that these variables grew month-over-month and red means that they fell. The shading or boldness of the color illustrates how strong the gain or loss was relative to history. At the bottom of the slide, we show how much each indicator has grown over the last six months—a rough reference to the more informal “two quarters” definition. Recently, elevated policy uncertainty has raised recession fears. While the broad-based expansion of these variables suggest that the U.S. economy is not in a recession, monitoring the indicators on this slide will allow us to monitor economic conditions in real time.