Slide Image

Sources of earnings per share growth
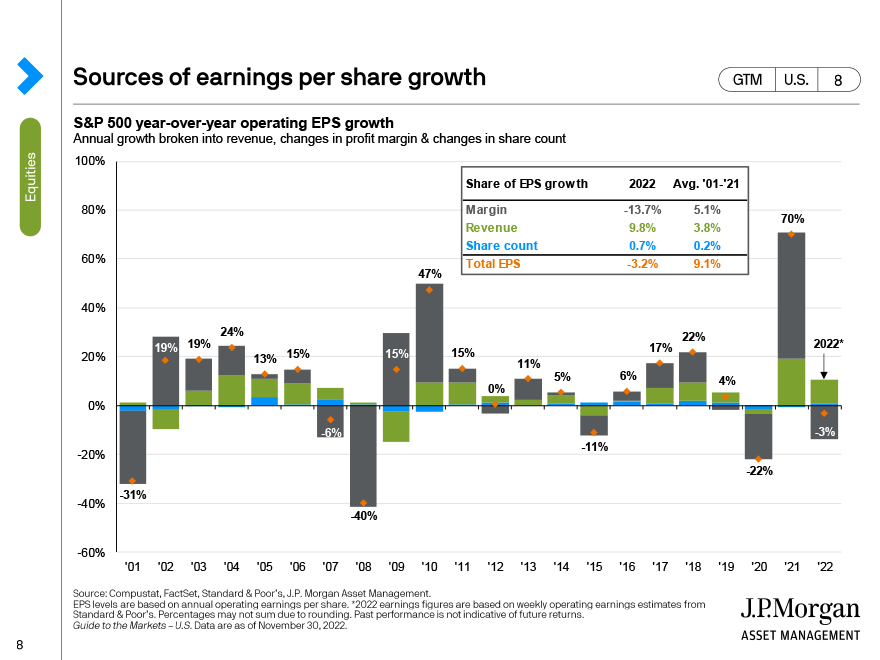
The chart decomposes S&P 500 annual earnings per share growth into three components – margins, revenues, and buybacks. The grey bar represents the contribution from margins, the green bar represents the contribution from revenue, and the blue bar represents the contribution from buybacks. In the top right hand corner, we show a breakdown of the current quarter’s year-over-year earnings growth, relative to the long-run average.
Coming out of the financial crisis, as well as the recession in the early 2000’s, margins were the main driver of earnings growth, as revenues were lackluster and companies were not in a position to buy back shares. However, what we have observed is that over the course of a cycle, the contribution from both buybacks and revenues tends to increase. This makes sense as companies find themselves in better financial shape, and economic growth accelerates back to a more normal pace. Thus, rather than dismiss or obsess over the impact of buybacks on earnings per share growth, investors should work to understand how it varies over the course of a business cycle.