Slide Image

Profit margins and input costs
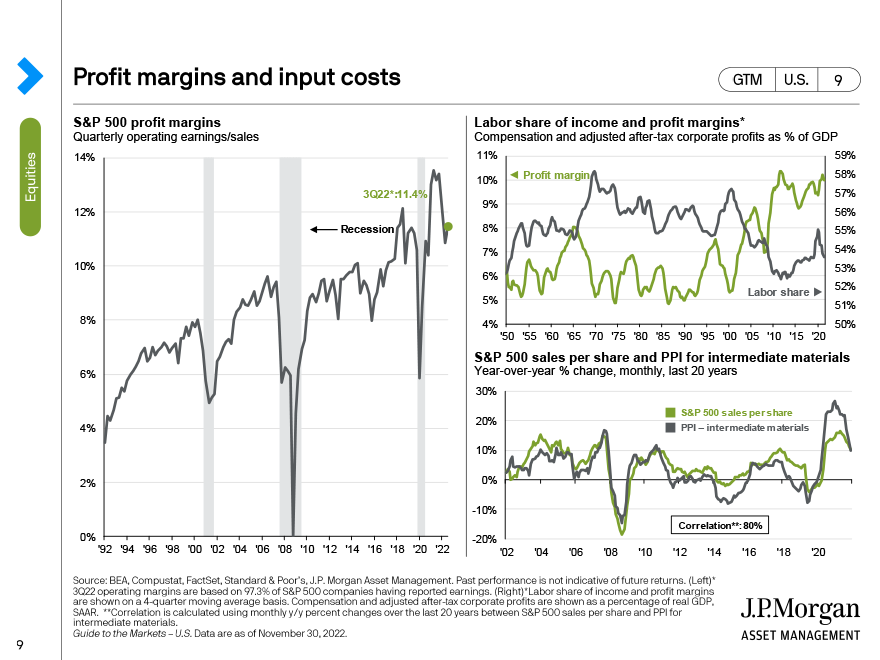
On the left hand side of this page, we show S&P 500 operating margins on a quarterly basis since 1999. We also highlight recessionary periods to illustrate that margins tend to crumble when the economy contracts. On the top right hand side, we show labor income and profit margins, both as a % of nominal GDP. As you can see, the two are typically inversely related. As labor income increases, profits margins tend to decrease. On the bottom right hand side, we show S&P 500 sales and PPI for intermediate materials, which as you can see have a very tight relationship. In other words, businesses are seemingly able to pass on higher costs.