Slide Image
Market inflection points, recessions and the unemployment rate
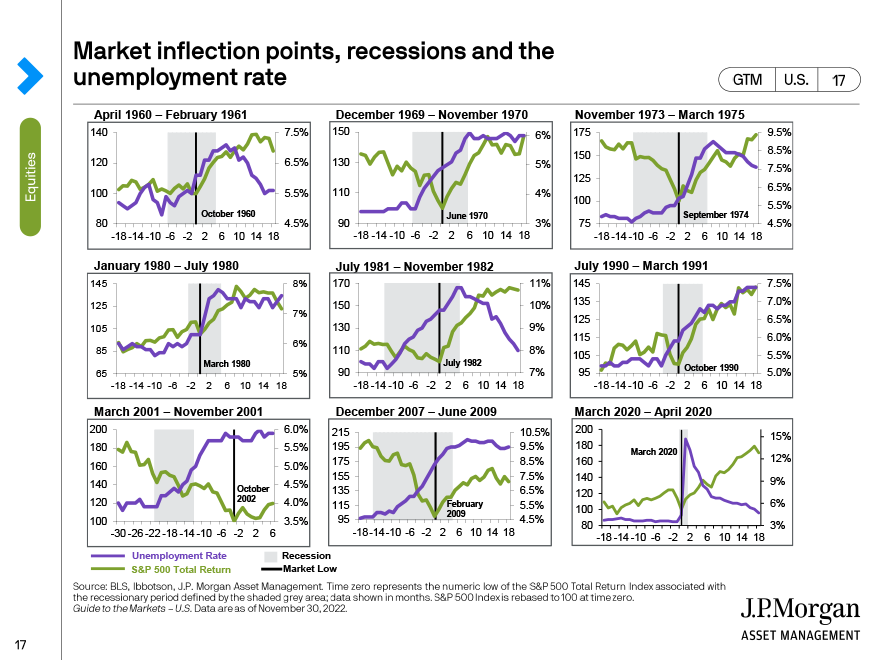
On this slide, we show historical recessionary periods in the United States from 1960 through the present. The slide helps illustrate how the stock market is a leading indicator, while the unemployment rate is a lagging indicator. As you can see, the stock market tends to, on average, trough before the peak unemploymet rate.