Slide Image

S&P 500 valuation measures
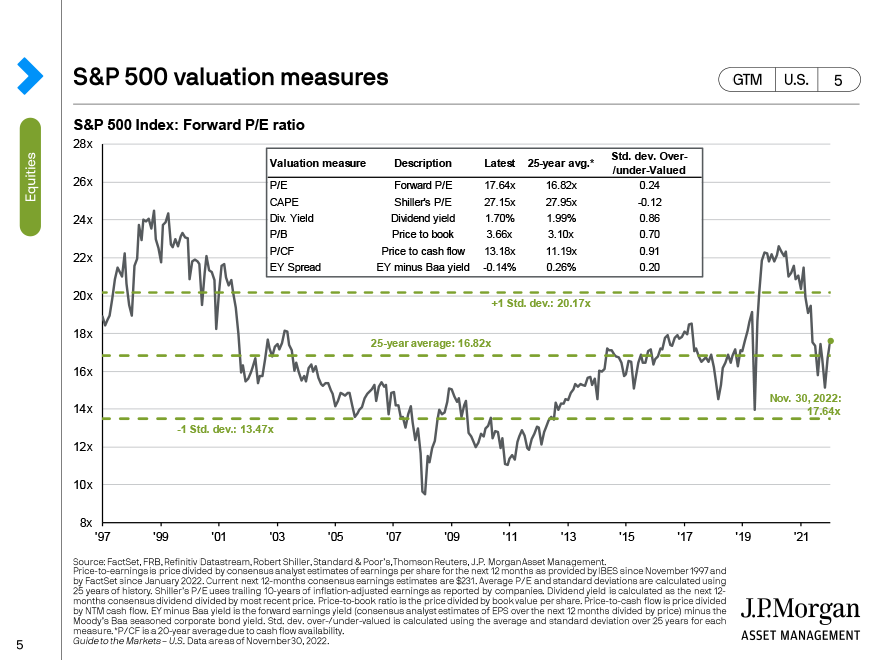
This slide shows various valuation metrics for the S&P 500 in the table, while the main chart shows the forward P/E over a 25-year history. The purpose of this slide is to evaluate whether or not the equity market appears overvalued, and if so, by how much, measured in standard deviations from their 25-year average.