Choosing a climate risk metric
Why J.P. Morgan Asset Management uses weighted average carbon intensity in its fund reporting
07-08-2019
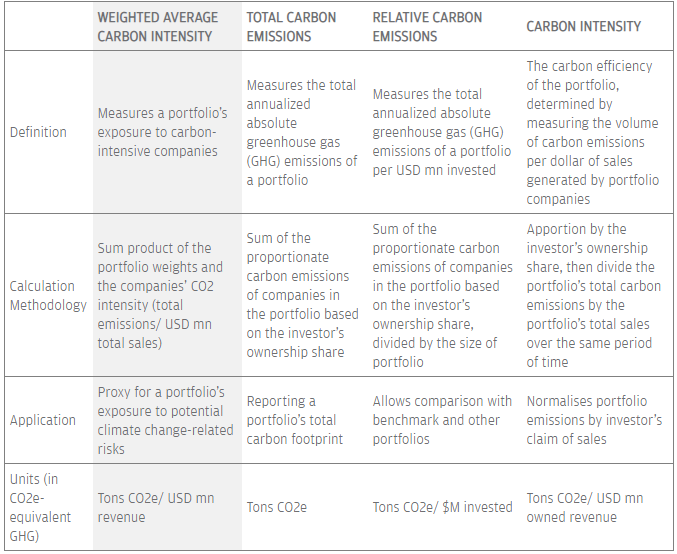
Four broad metrics exist to measure an investment portfolio’s carbon footprint—an important starting point in understanding a portfolio’s exposure to climate risks. Of the four, we’ve chosen the one we think is best to monitor and manage climate risks and opportunities in investment portfolios. Weighted average carbon intensity lets us understand, and disclose to clients, our portfolios’ exposure to climate change-related risk.1
It builds on three other MSCI metrics, described below. What we find makes weighted average carbon intensity most useful is that it’s fairly simple to calculate; it’s not sensitive to share price movements (since it’s not based on equity ownership); it can be measured across asset classes, including fixed income; and at the portfolio level it enables simple attribution analysis and portfolio decomposition.2
We choose weighted average carbon intensity as our preferred metric, but there are caveats. Weighted average carbon intensity relies on carbon footprint analysis, an important starting point that itself has limitations. It applies only one lens and is backward-looking—it doesn’t encompass company policies and other forward-looking information that may change. Excluded from weighted average carbon intensity analysis are short positions, sovereigns, derivatives, securitized products and bonds issued by trusts.
MSCI metrics may not fully reflect future economic reality. Our ESG specialists collaborate closely with our research analysts to understand when that may be the case, and where appropriate we engage with companies to improve disclosure and enhance policies. Where we think climate risk may be material, we review fossil fuel exposure, disclosed reduction targets going forward and other relevant information.
Source: “Final Report: Recommendations of the Task Force on Climate-related Financial Disclosures,” Task Force on Climate-related Financial Disclosures (2017), pp. 42–44.
1It is also recommended by the Task Force on Climate-related Financial Disclosures (“Final Report: Recommendations of the Task Force on Climate-related Financial Disclosures” (2017), pp. 36-37).
2Note that for certain portfolios focused on sustainability, the metric normalized carbon emission data per dollar invested may be a better indicator of impact.
0903c02a8265a69e