Investment themes for emerging market debt – Q2 2026
- EM debt fundamentals are strong – this is not 2022
- Higher oil prices create winners and losers
- Deepening domestic capital markets provide a strong foundation
- Back-up in yields presents a buying opportunity
- Risks: Geopolitics, private credit, structural fiscal & inflation
-
EM debt fundamentals are strong
-
Higher oil prices
-
Deepening domestic capital markets
-
Back-up in yields
-
Risks
The current market environment once would have been detrimental to emerging market debt (EMD). Markets across the world have sold off, but interestingly, EMD is acting similarly to developed market (DM) debt. Fears of higher energy and fertilizer prices have equally led to higher rates in both EM and DM. US dollar weakness over much of 2025 has reversed but EM currencies are performing in line with DM currencies. We believe the reason can be found when looking at the fundamentals of EM countries.
In conversations with clients, the current market environment is often being compared to 2022 and the Russia-Ukraine conflict, but we find stark differences. Over the past four years, EM countries have been repairing their finances and building resiliency after dealing with China’s property issues, the Covid pandemic, the Russian-Ukraine conflict and dramatic US policy rate hikes. EM countries are in a strong position to weather the current situation with capacity to act from a fiscal or monetary perspective. In some cases, EM countries are in a much stronger position than DM countries. We believe this backstop gives EMD a strong foundation to bounce back later in 2026.
EM debt fundamentals are strong – this is not 2022
EM sovereign fundamentals are stronger today
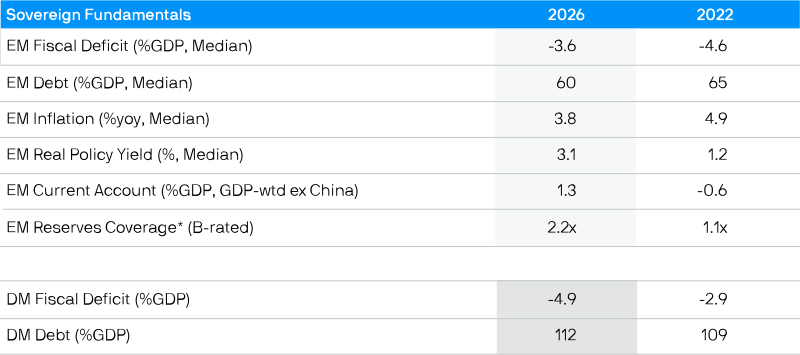
Source: J.P. Morgan Asset Management. Data as of 18 March 2026. 2026 and 2022 fundamental data reflects IMF and JPMAM data at aggregate or median levels as specified. *Reserves coverage = B-rated sovereigns, foreign reserves ex-gold divided by external debt service of next 12 months. Opinions, estimates, forecasts, projections and statements of financial market trends are based on market conditions at the date of the publication, constitute our judgment and are subject to change without notice. There can be no guarantee they will be met.
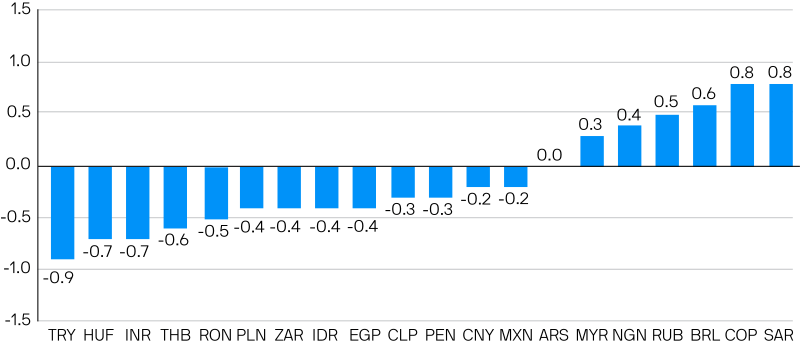
Before the current oil price spike, inflation was projected to return to target levels around 3.3% with growth around 4.1% for 2026. We predict that the if oil prices remain around $100 for the remainder of the year, leading to $85 for the whole of 2026, inflation will be around 0.4% higher and growth 0.3% lower than our initial estimates. While rising oil prices are negative to fundamentals, it is not a disastrous impact and certainly not in line with the current market which is mispricing the fundamentals.
It must also be recognised that higher energy prices are not negative for all but create opportunities for portfolios, if positioned correctly. Exporters that are not located in the conflict area can benefit from selling oil at a higher price or replacing the volume which is currently stuck in the Strait of Hormuz. In turn, countries which have built up large reserves or have transitioned to renewable energy are cushioned from the impact.
As such, we find the countries that are most negatively exposed to rising energy prices are in Emerging Europe and some countries in Asia.
Higher oil prices create winners and losers
Growth shock from sustained 20% oil increase
GDP growth impact from $85 annual average oil price for 2026
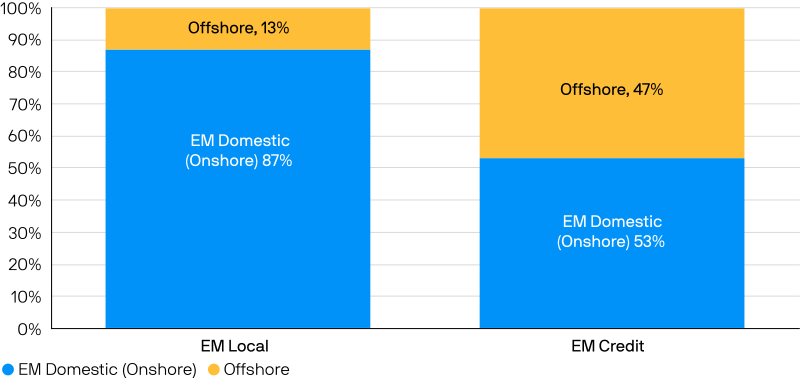
Another reason why EMD may have managed the current market uncertainty well is the changing investor base. Currently, domestic EM investors own the majority of the assets in the sector as domestic EM capital markets continue to grow along with larger pension plans, insurance companies and wealth managers.
At the same time, offshore investors have reduced their EMD holdings. Investors allocated away from EM starting in 2020 during the Covid pandemic and interest rate increases in developed markets. In 2025 and in the first quarter of 2026, some investors are reallocating. However, we calculate that there is still a $100 billion gap between the historical high for assets allocated to EMD and current investments.
From an asset allocator’s perspective EM represents 42% of global GDP and around 15% of global bond markets. However, our analysis shows that investors are under-allocated: pension plans and retail portfolios have, on average, 5% and 2% allocations, respectively.
Deepening domestic capital markets provide a strong foundation
EM debt increasingly held by domestic investors
Markets have panicked and this presents an opportunity for long-term investors. Rates have risen and spreads have widened over the past quarter. We believe this is a technical phenomenon as investors continue to risk-manage their portfolios. This is a prudent action to take in times of uncertainty.
The next steps for investors is to look for the appropriate time to re-enter the market. From a pure valuation perspective, with index yields over 6%, we think the opportunity will be arriving shortly as investors will look to capture the current level of high income available in the market.
For risk-conscious investors, in sovereign and corporate credit markets, an investment grade BBB issuer currently yields around 6%. For investors looking to add some high yield exposure, a diversified portfolio yielding 7% is achievable.
We believe that the most value has been created in local currency bond markets, where 8% yields are attainable in a diversified active portfolio.
Back-up in yields presents a buying opportunity
Nominal and real yields
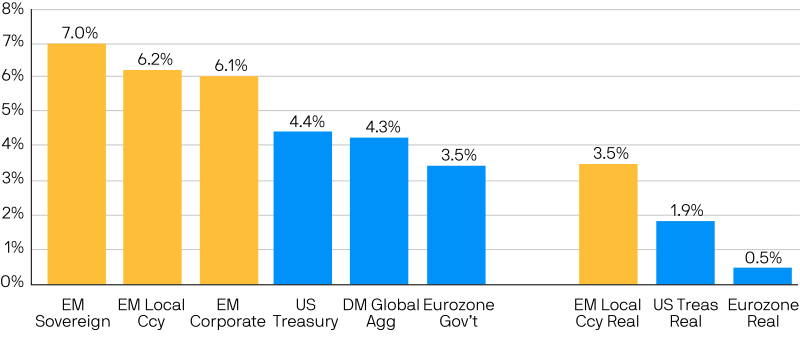
Source: J.P. Morgan Asset Management. Data as of 18 March 2026. Indices do not include fees or operating expenses. JPM EMBI Global Diversified (EM Sovereign), JPM CEMBI Broad Diversified (EM Corporate), JPM GBI-EM Global Diversified (EM Local Currency), JPM GBI US (US Treasury), JPM EMU (Eurozone Government), JPM GABI DM (DM Global Aggregate). Opinions, estimates, forecasts, projections and statements of financial market trends are based on market conditions at the date of the publication, constitute our judgment and are subject to change without notice. There can be no guarantee they will be met.
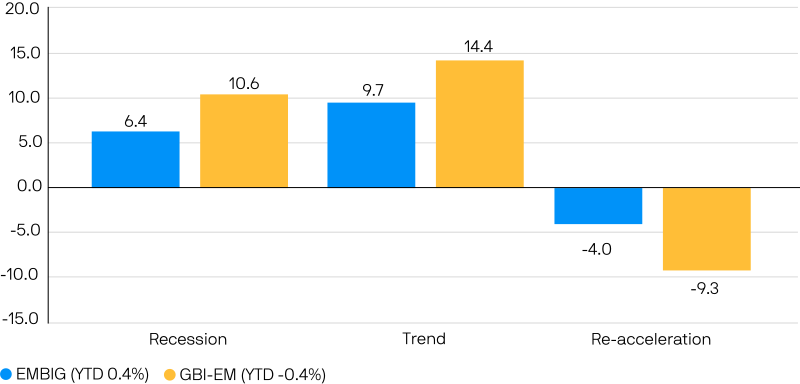
We break down our market environment scenarios into three categories: recession, trend growth and re-acceleration. Our central scenario of sub-trend growth has the highest upside, with returns between 10% and 14% for sovereign and local markets. With this said, tail risks continue to increase.
Re-acceleration is the most negative scenario for EMD. Increasing inflation that leads to a stronger US dollar and increasingly prices out central banks’ policy rate cuts would negatively impact local currency debt. Improving quality combined with a spread buffer leads to less negative returns in sovereign markets.
A recessionary market environment would deliver positive returns in EMD. Sovereigns would benefit from US policy rate cuts while spreads in the investment grade portion of the market would be expected to remain contained and act as a ballast for the market. In local debt markets, high policy rates give EM central banks capacity to significantly cut rates, offsetting US dollar strength.
In probability-weighted scenarios, we see positive returns for both sovereign and local markets of around 4%–7% for the rest of 2026.
Risks
2026 Return scenarios (%)