logo
  • My collections
    View saved content and presentation slides
  • Log out
  • Products

      Funds

      • Performance & Yields
      • Liquidity
      • Ultra-Short
      • Short Duration
      • European domiciled products

      Solutions

      • Cash Strategies
      • Cash Segmentation
      • Separately Managed Accounts
      • Managed Reserves Strategy

      Fund Information

      • Regulatory Updates
    • Insights

        Liquidity Insights

        • Liquidity Insights Overview
        • Global Liquidity Investment Outlook

          Global Liquidity Investment Outlook

        • Tokenization

          Explore the full whitepaper to learn how tokenized MMFs can transform your approach to cash management and position your organization at the forefront of digital finance.

        • Cash Cookbook

          The Cash Cookbook, your guide to cash and liquidity management success, helps you choose the right liquidity solution for your needs and risk tolerance.

        • Case Studies

          Read about companies with specific cash management challenges and the solutions when they worked with J.P. Morgan Asset Management.

        • Partnership with fintechs

          A focus on digital innovation and institutional liquidity solutions drive our dynamic partnership with fintech.

        • ESG Resources for Liquidity Investors

          We’ve created a clear, rigorous ESG process meets the many needs of liquidity investors.

        • Leveraging the Power of Cash Segmentation

          The most effective strategy incorporates a clear investment policy, well-defined goals and parameters for liquidity, quality and return.

        • Cash Investment Policy Statement

          How to write an investment policy statement for your organization

        Market Insights

        • Market Insights Overview
        • Eye on the Market

          Explore Eye on the Market, timely commentary that offers views on the economy, markets, and investment portfolios by Michael Cembalest.

        • Guide to the Markets

          The J.P. Morgan Guide to the Markets illustrates a comprehensive array of market and economic histories, trends and statistics through clear charts and graphs.

        • Market Updates

          Read our weekly commentaries to get market insights that may help inform your investment strategy.

        • Podcast: Markets Explained

          Signal or noise? In this weekly podcast, Karen and Hugh digest the newsflow in an increasingly tumultuous world and work out what it means for global investors.

        Portfolio Insights

        • Portfolio Insights Overview
        • Currency

          Our currency team provides solutions for clients, controlling risk using passive management strategies and generating returns by actively managing global currencies.

        • Fixed Income

          A complex mix of monetary, credit and fiscal forces is changing the bond landscape. Discover how flexible fixed income approaches can seek returns, income and resilience.

        • Long-Term Capital Market Assumptions

          Our Long-Term Capital Market Assumptions (LTCMAs) deliver forward-looking return, volatility and correlation estimates for 200+ asset and strategy classes in 20+ base currencies.

        • Sustainable investing

          We believe that ESG considerations can play a critical role in a long-term investment strategy.

        • Strategic Investment Advisory Group

          The Strategic Investment Advisory Group approaches today’s investment challenges with a global view across asset classes.

      • Resources
          • Overview
          • MORGAN MONEY
          • Account Management & Trading
          • Global Liquidity Investment Academy
          • Announcements
        • About us

            About us

            Backed by $4.6T in assets, we harness our active edge to deliver timely ideas and actionable insights that empower investors to achieve what matters most.

            • Overview
            • Diversity, Opportunity & Inclusion
            • Spectrum: Our Investment Platform
            • Our Leadership Team
            • Our Commitment to Research
          • Contact us
          • English
          • MORGAN MONEY LOGIN
            • My collections
              View saved content and presentation slides
            • Log out
          • Log in
          • MORGAN MONEY LOGIN
          Log in
          You are about to leave the site Close
          J.P. Morgan Asset Management’s website and/or mobile terms, privacy and security policies don't apply to the site or app you're about to visit. Please review its terms, privacy and security policies to see how they apply to you. J.P. Morgan Asset Management isn’t responsible for (and doesn't provide) any products, services or content at this third-party site or app, except for products and services that explicitly carry the J.P. Morgan Asset Management name.
          CONTINUE Go Back

          <p>Global Bond Monitor Q4 2025</p>

          This piece uses five charts from the Guide to the Markets to explain why, despite an uncertain economic backdrop and recent volatility, we still see compelling opportunities across the fixed income landscape.

            1. Home
            2. Insights
          1. Portfolio Insights Overview
          2. Fixed Income Insights | Portfolio Insights

          Global Bond Monitor Q4 2025

          This piece uses five charts from the Guide to the Markets to explain why, despite an uncertain economic backdrop and recent volatility, we still see compelling opportunities across the fixed income landscape.


          Investors have typically looked to bonds for two outcomes:


          1. A steady stream of income

          2. Diversification against riskier assets if the growth outlook deteriorates.


          In the decade following the global financial crisis the ability of bonds to offer either of these elements had steadily diminished as a long bull market compressed yields to record low levels. The subsequent reset in 2022 was deeply painful. As yields normalised, the global aggregate bond index fell by 16%, the worst annual decline since the index began in 1990. But the fixed income reset is now complete. Yields have established new trading ranges and the role of bonds in a balanced portfolio has been restored.


          A combination of tariff-related inflation concerns and expansionary fiscal policy across the developed world has kept bond market volatility high and led some investors to remain nervous about the asset class. However, taking a step back it is clear that the two key characteristics bonds have historically provided remain relevant, and the bond market of today is not the same as the bond market of 2022. With prudent risk management, fixed income still deserves its place in multi-asset portfolios.

          • Diversification potential has improved

          • Higher starting yields give bonds more breathing room

          • Changing dynamics in European fixed income provide new opportunities

          • High starting yields have historically led to positive returns

          • Corporate fundamentals should support tight credit spreads

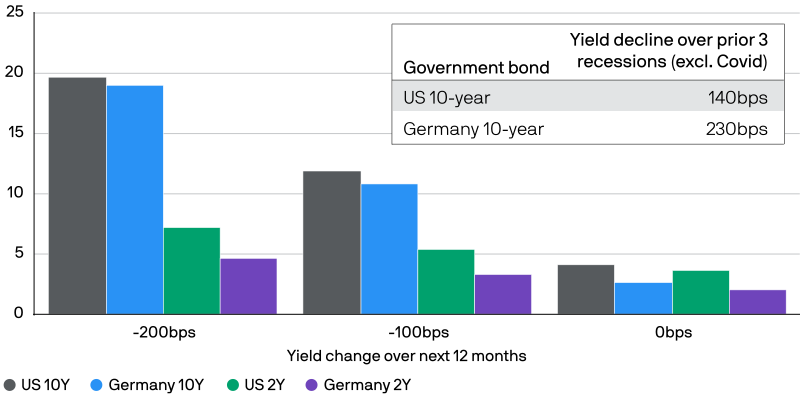
          Our first chart considers the total return that investors would receive from government bonds, depending on how yields move over the next 12 months. If the economic outlook deteriorates over the coming months, the pressure on central banks to cut interest rates will only intensify. In this scenario, bond yields still have significant room to fall from current levels. In the event that 10-year government bond yields fell by 100 basis points over the next 12 months, this would deliver a return of more than 10%.


          This is the kind of meaningful diversification against equity losses that multi-asset investors rely on when constructing balanced portfolios, which has not been available for several years given the very low level of yields.


          Government bond return scenarios

          %, total return over 12 months
          diversification-potential
          Source: LSEG Datastream, J.P. Morgan Asset Management. Chart indicates the calculated total return achieved by purchasing the given government bond at its current yield and selling in 12 months’ time given various changes in yield. For illustrative purposes only. Past performance is not a reliable indicator of current and future results. Guide to the Markets - EMEA. Data as of 31 October 2025.

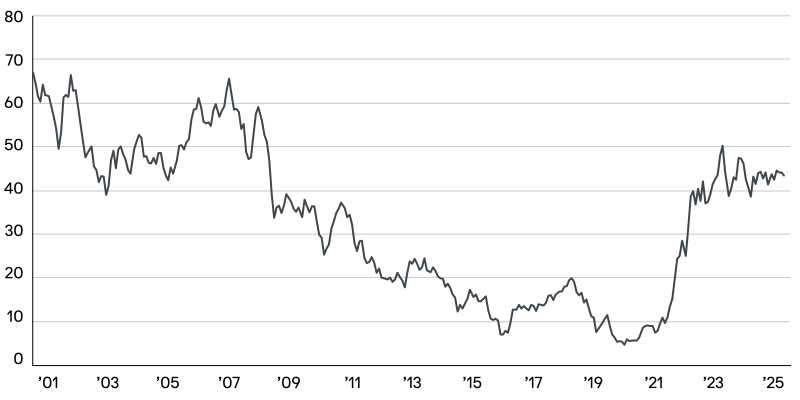
          Global rates volatility remains elevated as governments grapple with fiscal realities, and markets shift their focus to whichever country is currently in the spotlight. However, these pressures are reflected in higher starting yields which provide a meaningful buffer against bond losses. The yield cushion on global government bonds, which shows how much sovereign yields could rise over 12 months before capital depreciation wipes out one year’s worth of income, has risen from its pre-pandemic low to around 45 basis points. Fixed income investors thus benefit from a substantial buffer against ongoing policy-related uncertainty.


          Global government bond yield cushion

          Basis point change over 12 months
          higher-starting-yields
          Source: Bloomberg, LSEG Datastream, J.P. Morgan Asset Management. Yield cushion refers to how far yields can rise before capital depreciation wipes out one year’s worth of income. Index used is the Bloomberg Global Aggregate – Treasuries index. For illustrative purposes only. Past performance is not a reliable indicator of current and future results. Guide to the Markets - EMEA. Data as of 31 October 2025.

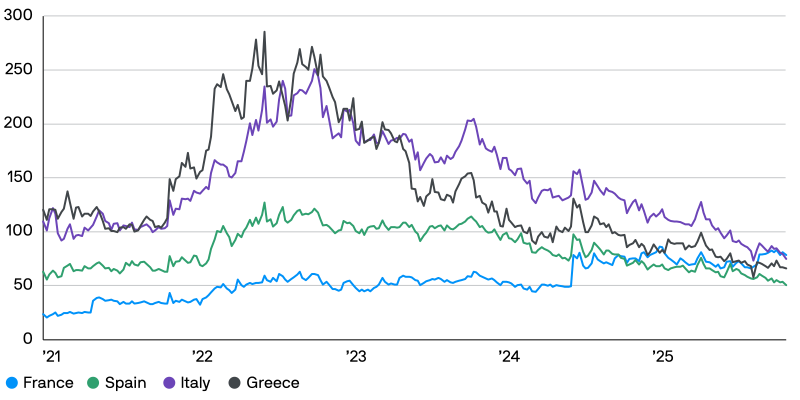
          In Europe, peripheral countries, which had long been seen as lower quality credits, are looking increasingly attractive. A combination of stronger growth, helped by ongoing fiscal transfers from the European recovery fund, and fiscal consolidation following the eurozone sovereign debt crisis has benefited countries like Italy and Greece which have seen the spread between their bonds and German Bunds shrink. Conversely France, which had been part of the European core of lower risk countries, has struggled to resolve its fiscal impasse and has seen its spread widen. Nimble investors who can access the full opportunity set of European bonds can use this changing dynamic to manage country specific risks and improve returns.


          Spread to German 10-year government bond yield

          Basis points
          european-fixed-income
          Source: LSEG Datastream, J.P. Morgan Asset Management. Past performance is not a reliable indicator of current and future results. Guide to the Markets - EMEA. Data as of 31 October 2025.

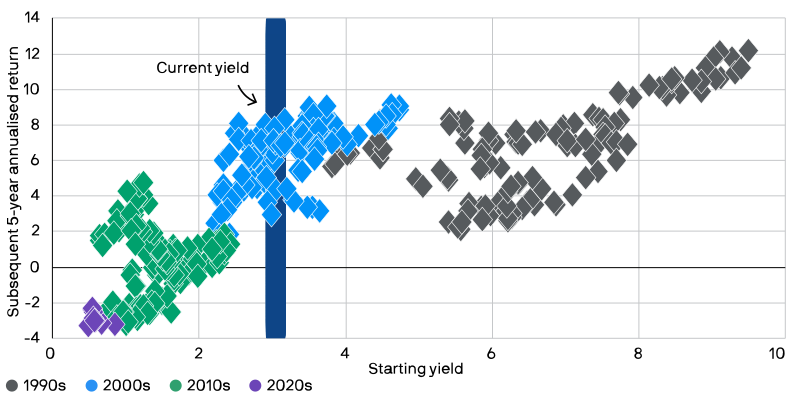
          Our fourth chart looks at the impact of starting yields on subsequent returns. Investors are aware of the impact of equity valuations on subsequent medium-term returns, and the same dynamic is true in fixed income. After the period of low interest rates following the global financial crisis, government bond yields have now returned to a more normal range. This reset in yields significantly improves the return profile of fixed income as higher starting yields have historically led to higher subsequent returns. From current starting yields, investors have typically enjoyed annualised returns of around 6% over the subsequent five years.


          Global government bond yields and subsequent 5y returns

          %, subsequent return is % change annualised
          higher-starting-yields-2
          Source: Bloomberg, LSEG Datastream, J.P. Morgan Asset Management. Index used is the Bloomberg Global Aggregate – Treasuries index in US dollars and thus returns include currency effects. Past performance is not a reliable indicator of current and future results. Guide to the Markets - EMEA. Data as of 31 October 2025.

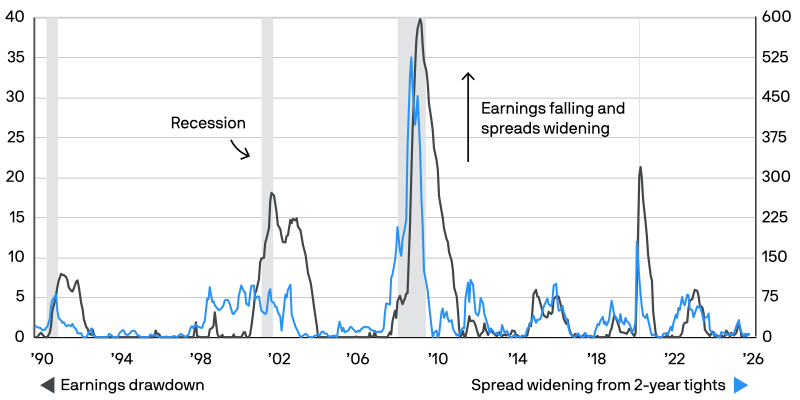
          A combination of attractive all-in yields and resilient corporate fundamentals has led to heightened demand for investment grade corporate credit. This has compressed corporate spreads to historically low levels. Investors may be tempted to wait for a more attractive entry point, however they could be waiting for some time. Credit spreads are biased towards the tighter end of their ranges and only widen significantly when growth weakens materially. As our fifth chart highlights, so long as corporate earnings don’t fall credit spreads should remain contained and investors can step out into credit to capture the additional income on offer.


          US earnings drawdowns and US investment grade spreads

          % drawdown from previous peak (LHS); basis points (RHS)
          corporate-fundamentals
          Source: Bloomberg, IBES, LSEG Datastream, S&P Global, J.P. Morgan Asset Management. Earnings drawdown is based on S&P 500 12-month forward earnings per share, as published by IBES. Spreads are Bloomberg US Aggregate – Corporate option-adjusted spreads. Periods of recession are defined using US National Bureau of Economic Research (NBER) business cycle dates. Past performance is not a reliable indicator of current and future results. Guide to the Markets - EMEA. Data as of 31 October 2025.

          Conclusion

          The opportunities available in fixed income remain attractive. The reset higher in yields means bonds can deliver sustainable income in the medium term, and provides a buffer against further volatility. Absent a shock to growth, yields and spreads are likely to remain contained and investors should position their portfolios to capture the income on offer. However, if the outlook does deteriorate then government bond yields have room to fall, providing diversification against equity losses. These factors mean that after a decade in the doldrums, the role of bonds in multi-asset portfolios has been restored.