Emerging Markets: Don’t Fight the Central Banks
06-08-2020
Zsolt Papp
“Nothing in life is to be feared. It is only to be understood” (Marie Curie)
Earlier this year in March, emerging markets debt (EMD) appeared to be destined for a potentially toxic confluence of ex- and endogenous factors, an event that creates fear among investors. Four months on, the picture looks far less dramatic. The sell-off was not as bad as feared, the recovery has been faster than expected and the IMF forecasts a dynamic growth recovery going into 2021. However, the real tailwind is coming from central bank policies, which together with attractive valuations underpin the investment case for the asset class.
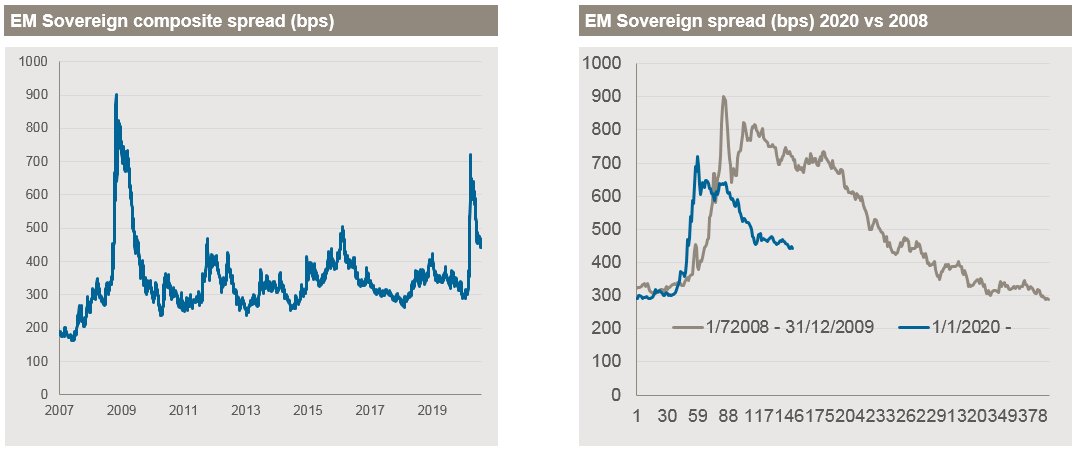
Source: Bloomberg, JPMAM, Data as at 28.07.2020. JPM EMBI Global Diversified spread
EM recovering faster than DM
One of the questions back in March was whether the market would react differently in this sell-off than in prior economic events, as we were faced with the unknown impact Covid-19 would produce. The answer so far is “no”. As highlighted then, the sell-off looked very similar to the events post Lehman’s downfall during the Great Financial Crisis (GFC), with a sharp spike and brief pause followed by a relatively dynamic recovery. In fact, the mid-March spread level of 689 basis points turned out be to be peak, the recovery has been faster and we have spared a double-dip, at least so far. From today’s view point, therefore, this sell-off looks like somewhat milder version of the events that followed Lehman.
However, is this justified in view of the uncertain economic outlook? Based on the latest IMF forecasts (World Economic Outlook June 2020) the answer is probably yes, as emerging markets are expected to recover more dynamically than developed markets (DM). The IMF predicts that China will be leading the recovery, but the rest of EM will be also ahead of DM. In fact, the IMF forecasts DM GDP will not return to pre-crisis level before 2022.
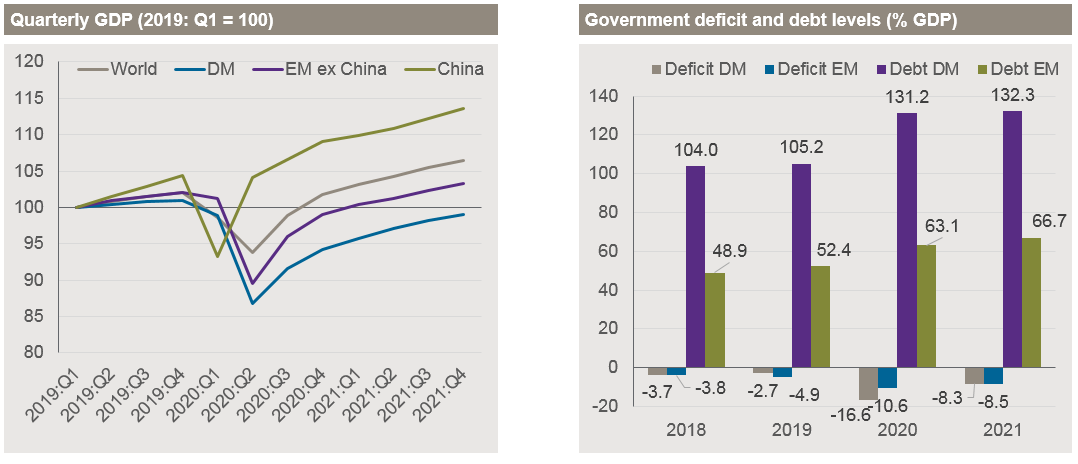
Source: IMF, World Economic Outlook June 2020
The picture is similar for public finances: government deficits are forecast to deteriorate much more in DM than EM. One reason is that DMs are deploying much bigger fiscal stimulus packages. The IMF calculates that additional spending, foregone revenue, loans, equity and guarantees will amount to 20% of GDP compared to only 5% in EM. However, such fiscal largesse comes at a price; DM government debt is expected to exceed 130% of GDP by the end of 2020, compared to only 63% of GDP in EM. In short, the macro case for EM looks better than for DM.
Liquidity vs solvency
Previous crises have shown that good macro prospects alone may not prevent liquidity stress, which in the worst case could turn into solvency stress. There is no doubt that some EM countries have benefited from DM & IMF support in the current crisis. The IMF acted decisively by launching new programmes aimed at avoiding liquidity stress for the most vulnerable EM countries in additional to traditional instruments. Both magnitude and scope of these programmes has been without precedence and as of mid-July more than 50 countries have received some form of financial aid.
The Paris Club of official creditors complemented the picture by launching the G20 Debt Service Suspension Initiative (DSSI) and while it has been less popular with some of the debtor countries, it underpins the breadth and depth of financial intervention at international level to avoid an economic crisis turning into a global financial crisis.
Central banks have been equally quick to pump liquidity into the system. In addition to traditional central bank tools such as interest rate cuts so-called unconventional policies have become very conventional in this crisis. The Federal Reserve (Fed) has moved from buying Treasuries to mortgage-backed securities (MBS), then bond ETFs and lately direct corporate bond purchases including high yield. The European Central Bank (ECB) has had similar programmes in place for some time and therefore hesitated even less than the Fed to top up its bond purchases.
EM central banks have not been idle either. More than 80% have cut interest rates by a combined total of more than 3000[1] basis points so far this year. On average, we calculated a reduction of 150 basis points by country, which is in line with the Fed cuts. On top of that, a significant number of EM central banks have implement quantitative easing (QE) programmes. Central bank intervention is nothing new in EM, but traditionally it has been taking place behind the scenes, often with the help of government agencies or domestic banks. The public announcement of QE-style interventions is therefore not only an embracing of unconventional monetary policies but an overdue step for more transparency.
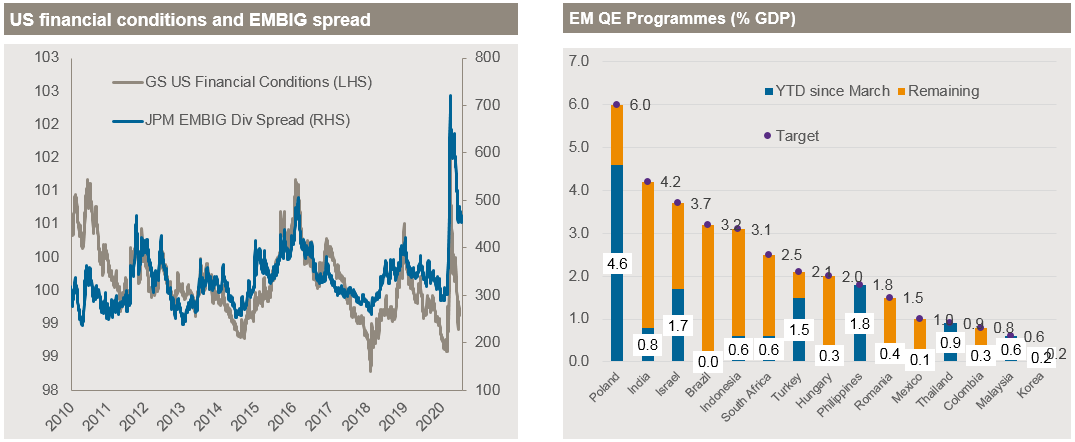
Source: J.P.Morgan Asset Management, EM central banks, Bloomberg, Goldman Sachs (GS). Data s at 27.07.2020
Emerging market QE programmes are aimed at local markets in order to ensure sufficient liquidity and financial market stability for lenders and borrowers in local currency. This is critical, because domestic debt accounts for 83% of total outstanding EM debt. Hard currency (aka external) debt is not negligible and often regarded as a bellwether for EM debt in general, its role in financing EM economies is much less important. This is particularly the case in Asia, but domestic debt is also bigger in Latin America, EM Europe, and Middle-East and Africa.
The last thing investors would like to see is EM central banks purchasing foreign currency bonds. Not only would this be an inappropriate usage of precious FX reserves, it is also questionable how effective it could be. The chart above on the left shows that US financial conditions are a key driver of EM external debt spreads, which in essence boils down to Fed monetary policy. Simply put, Fed easing is good for EM debt spreads and likely much more effective than EM central bank buying hard currency debt.
Don’t fight the central banks
As mentioned at the beginning, EM debt has performed well after the sell-off with EM sovereign debt, gaining +24.27% and EM local currency debt 19.05%[2], which lends support to the point that late March / early April was an opportune moment to enter the market. This, however, raises the question of how much upside is left in the asset class. The good news is that the macro outlook – while not without risks – is constructive. The IMF forecasts a dynamic recovery going into 2021 with lower levels of leverage than in DM, which in turn underpins the superior long-term growth story for EM.
Further good news is that even after this rally, valuations are still attractive. Emerging market investment grade (EM IG) hard currency yield is trading between 140-200 basis points, yielding higher than comparable US or Euro credit with similar credit risk. As of late July, the blended[3] EM IG yield stood at 2.92% compared to 1.58% for US IG and 0.91% for Euro IG hedged into USD. And current spread levels continue to offer attractive return prospects. The entry level in April suggested a return of more than 20% (GFI Blog Emerging Markets Debt – Time to Buy?), however, at current levels EM IG has historically still returned 15% over two years. In short, EM IG remains a highly attractive choice for investors sensitive to credit and in particular default risk.
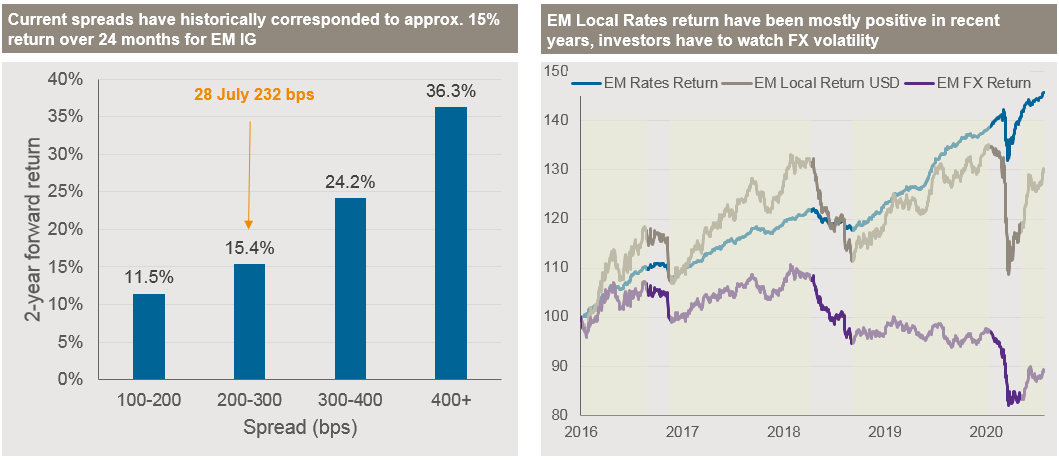
Source: Bloomberg, JPMAM, Data as at 28.07.2020. Left chart: 50-50 blend EMBIG Div IG – CEMBI Broad Div IG. Right chart: GB-EM Global Div total return indices re-balanced to 1.1.2016 = 100.
As for local currency, the right chart above shows that EM rates typically generate positive returns, except in extreme situations such as idiosyncratic events in EM (Turkey and Argentina 2018) or global market sell-off this year. But even then the recovery tends to be relatively quick. Emerging market FX by definition is more volatile, but perhaps contrary to general perception, periods of relative stability suffice to generate an overall positive return for the asset class. Good examples are 2017-2018 or 2019, when EM FX was range trading. Similar to rates, it is extreme events which tend to push EM FX into negative territory. However, the chart also shows that EM local currency tends to recover to above pre-correction levels, which implies high single-digit or double-digit gains over the next 12 months.
In conclusion, the outlook for EM debt is constructive, valuations are attractive, especially relative to DM debt, and prospective returns adequately compensate for the risks, which are manageable. The opportunity cost of not investing in EM debt remains very high. Most importantly, though, the same applies for the rest of fixed income: don’t fight the central banks.
[1] Central banks of Brazil, Chile, China, Colombia, Czech Rep, Dom Rep, Hungary, India, Indonesia, Korea, Malaysia, Mexico, Peru, Philippines, Poland, Romania, Russia, South Africa, Thailand, Turkey. Data as at 27.07.2020
[2] 50-50 blends of government and corporate bond indices: EM = EMBIG Div IG – CEMBI Broad Div IG. US = JPM GBI US – JPM IG ex EM Credit. Euro = JPM EMU IG – JPM MAGGIE (hedged in USD).
[3] Central banks of Brazil, Chile, China, Colombia, Czech Rep, Dom Rep, Hungary, India, Indonesia, Korea, Malaysia, Mexico, Peru, Philippines, Poland, Romania, Russia, South Africa, Thailand, Turkey. Data as at 27.07.2020