Macroeconomic: The new old normal: Moderate growth but a little more inflation
- For the first time in many years, we raise our long-term inflation projections across a range of economies, detecting a different inflationary dynamic: Post-recession, output gaps are closing quickly; meanwhile, stimulative fiscal and monetary policies are working in partnership.
- Our global growth forecast sees upside risks from technology and greater labor force participation, yet countering headwinds abound: stalled globalization; a less immigration-friendly atmosphere; the long-expected, gradual slowing of Chinese growth; and continuing weak demographics globally.
- We shave our global real growth forecast slightly, to 2.2%, for our set of economies. Developed market (DM) nominal growth edges up, reflecting a small downgrade to real GDP and the uplift in our inflation forecast.
- Emerging market growth edges down in both real and nominal terms, reflecting cuts to the China and India real GDP forecasts.
- We raise our trend growth expectations in several DM economies, despite a year of powerful growth since the 2021 edition.
Our 2022 assumptions anticipate slower real GDP growth globally, mostly because last year’s cyclical bonuses have been removed, and somewhat higher inflation
MACROECONOMIC ASSUMPTIONS (%, ANNUAL AVERAGE)
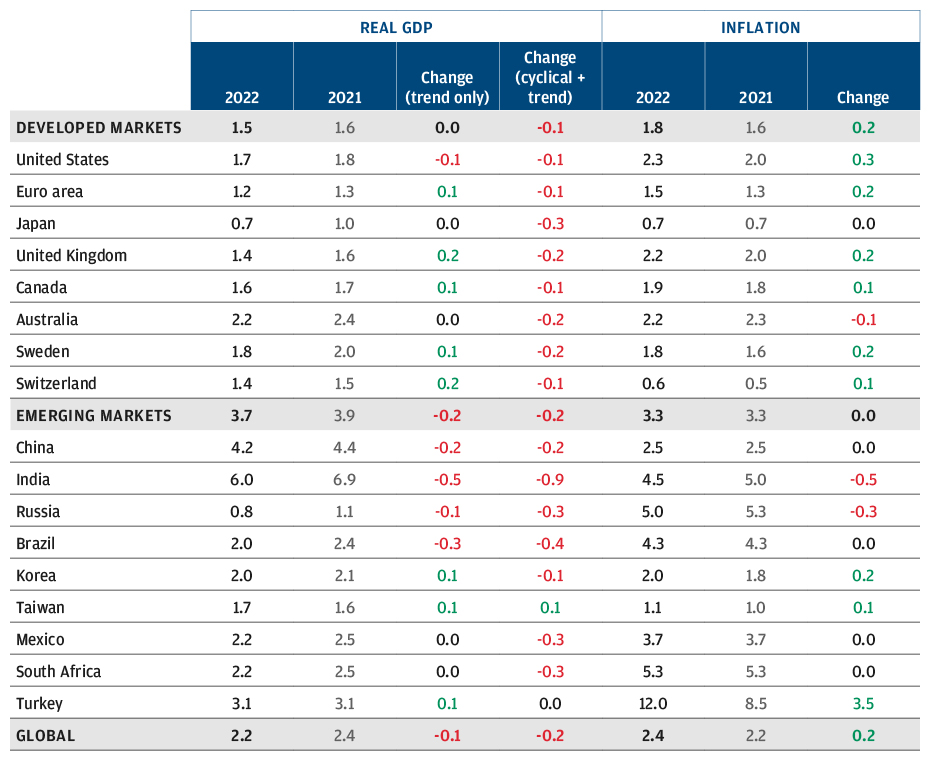
Source: J.P. Morgan Asset Management; estimates as of September 30, 2021. Previous year’s real GDP forecasts shown include cyclical bonuses. Given depressed post-shock starting points, in last year’s edition we added cyclical bonuses to our 2021 trend growth projections. This year, our 2022 forecasting returns to trend rates alone. In comparing 2021 with 2022 trend rates here, we do not use last year’s rate-plus-cyclical-bonus figure but only the trend rate.
Fixed income: Higher inflation expectations change the pathways for interest rates
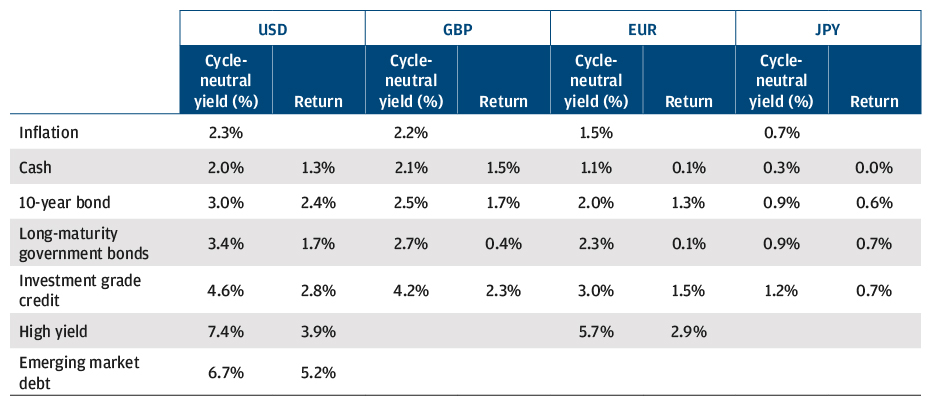
- We raise our cash rate assumptions modestly, in line with this year’s slightly higher inflation forecasts but not to exactly equal our inflation forecast upgrade; we expect central banks, in most cases, to maintain negative real rates while inflation rises.
- Our assumptions are little changed but for shortening the window for normalization; we see 10- and 30-year bond yields rising from the start. By rising faster than cash rates, the yield curve steepens for much of our forecast period.
- Central banks’ differentiated inflation-targeting credibility influences our assumptions more strongly than usual, changing the speeds at which we expect different economies’ cash rates and long bond yields to normalize.
- We expect real cash rates and real bond yields to remain depressed, relative to underlying economic growth, for much of our horizon, reflecting coordinated fiscal and monetary policy, as well as policies broadening to include social goals such as “greening” economies.
- We give a small lift to government bond returns. In credit, U.S. investment grade returns rise while high yield returns decrease, which reduces the relative attractiveness of high yield vs. other risk assets.
Inflation expectations influence our 2022 assumptions
STANDARD G4, IG, HY AND EMD FIXED INCOME RETURN PROJECTIONS
Source: J.P. Morgan Asset Management; estimates as of September 30, 2021.
Long-maturity government bond index: Citi EMU GBI 15+ yr EUR; Citi Japan GBI JPY; FTSE UK Gilts Under 15+ yr GBP and Bloomberg U.S. Treasury 20+ yr USD. High yield: Bloomberg US High Yield 2% Issuer Cap USD and Bloomberg Pan-European High Yield EUR. Emerging market debt: J.P. Morgan EMBI Global Diversified Composite. Cycle-neutral: the average yield we expect after normalization.
Equity assumptions: Better through-cycle returns, challenging starting point
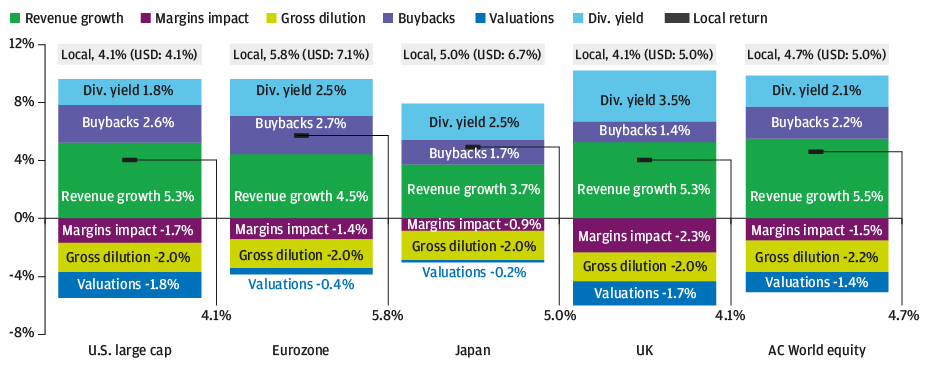
- Our long-term equity return assumptions are only mildly lower, despite a year of strong equity market performance.
- Our continuing research into equilibrium margin and valuation assumptions leads us to upgrade our fair value estimates, further reflecting the impact of sector composition, leverage, shareholder returns and the rate environment.
- This supports the equilibrium component of our equity return forecasts. The cyclical component of our forward-looking returns, however, becomes a bigger drag, as margins have spiked higher, and are expected to fall from here.
- Emerging market stocks retain their return premium in our forecasts, mainly due to their superior revenue growth prospects. However, that premium has narrowed, and EAFE equities offer a superior Sharpe ratio.
Our 2022 equity return assumptions decline across most regions
SELECTED DEVELOPED MARKET EQUITY LONG-TERM RETURN ASSUMPTIONS AND BUILDING BLOCKS
SELECTED EMERGING MARKET EQUITY LONG-TERM RETURN ASSUMPTIONS AND BUILDING BLOCKS
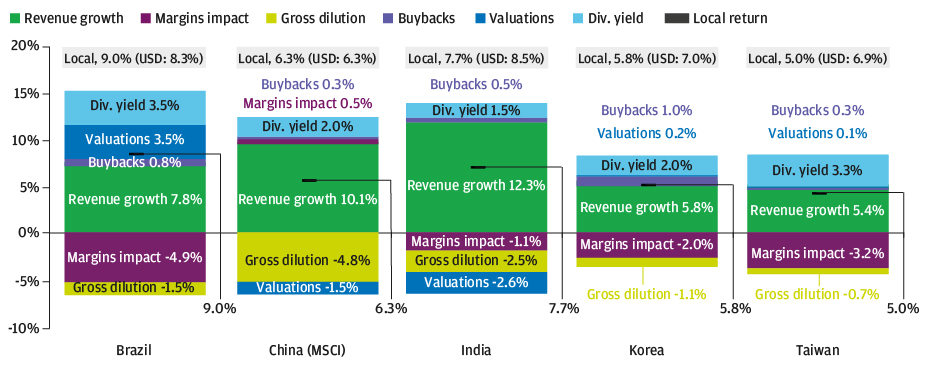
Source: J.P. Morgan Asset Management; estimates as of September 30, 2020, and September 30, 2021. Components may not add up to totals due to rounding.
Currency exchange rate: Is the U.S. dollar unassailable as the premier reserve currency?
- During the pandemic-induced global recession, the USD was a more resilient safe haven than other currencies; today, it remains well behaved while demand rebounds. We continue to view the currency as overvalued but have some reservations about forecasting the magnitude and timing of its depreciation.
- A narrowing in global yield differentials as relative growth tilts in favor of economies outside the U.S. suggests an erosion of the USD’s secular strength.
- As in last year’s projection, we think that a weaker starting point for the U.S. economy in this cycle can act as the catalyst for our long-held expectation of secular USD depreciation; however, we do not see an imminent catalyst.
- Vs. the USD, we expect that:
- Our methodology for estimating the purchasing power parity of developed market currencies has been refined: We now systematically remove housing inflation from our calculations.
–the eurozone’s strong external account, union-wide fiscal risk-sharing and robust fundamentals will drive the euro’s appreciation;
–the pound sterling will appreciate as the end of uncertainty over Brexit outweighs the still-adverse reality of a narrow Brexit that is hurting export growth;
–the Japanese yen, whose purchasing power has reached a half-century low, will appreciate at least nominally;
–although the Chinese renminbi enjoys strong secular support, it will not become a premier reserve currency in the near term, and geopolitical tensions will limit its appreciation to less than fundamentals alone would imply.
Valuations, albeit with less vigor, continue to signal dollar depreciation
ASSUMPTIONS FOR CHANGES IN SELECTED CURRENCY EXCHANGE RATES VS. USD, NOMINAL AND REAL
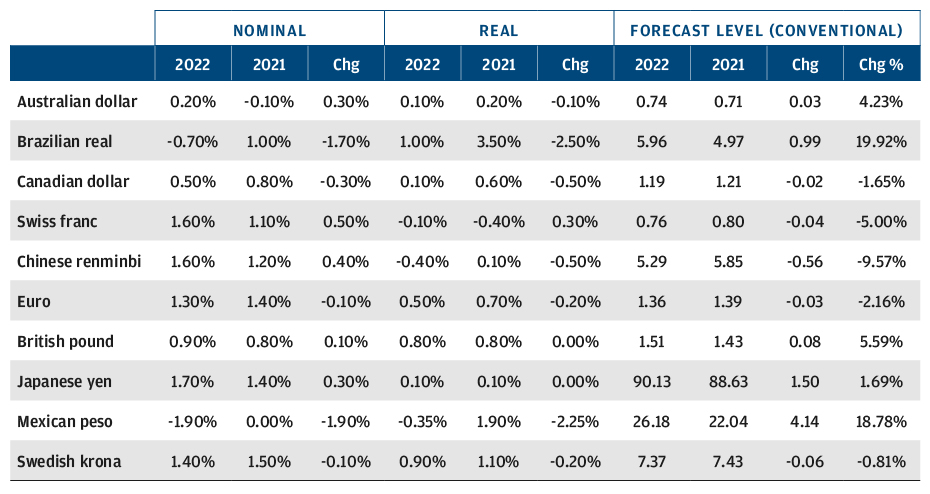
Source: J.P. Morgan Asset Management; data as of September 30, 2020 and September 30, 2021.
Alternative asset assumptions: Reaching investment objectives when traditional assets may not be enough
A fertile environment for alpha generation drives our estimates for financial alternatives. Real asset assumptions are flat to slightly lower than last year’s, due in part to a more advanced economic recovery. Our return assumptions are for the median manager; due diligence is key to realizing the full potential of an allocation.
Private equity (PE):
Return assumptions increase slightly. Continuing innovation and transformation, expanding PE markets globally and new, potentially return-enhancing investment tools energize alpha.
SELECTED ALTERNATIVE STRATEGIES – RETURN ASSUMPTIONS (LEVERED,* NET OF FEES, %)

Direct lending:
Return estimates are stable year on year, even as underwriting disciplines and yield premiums vs. public debt hold steady and asset growth rises.
SELECTED ALTERNATIVE STRATEGIES – RETURN ASSUMPTIONS (LEVERED,* NET OF FEES, %)

Hedge funds:
Assumptions are raised for most major strategies on expectations for an alpha upturn. Our outlook anticipates reductions in fees, asset flows and competition, along with rising rates, volatility, return dispersion and allocations to private investments.
SELECTED ALTERNATIVE STRATEGIES – RETURN ASSUMPTIONS (LEVERED,* NET OF FEES, %)

Real estate:
Return estimates decline slightly across regions, given lower or flat starting yields partially offset by stronger net cash flow growth. We expect continued performance dispersion among sectors and improvement in rental rates. REITs returns are also down, reflecting less upside potential following their recent strong recovery.
SELECTED ALTERNATIVE STRATEGIES – RETURN ASSUMPTIONS (LEVERED,* NET OF FEES, %)


Infrastructure:
Return estimates are unchanged. We expect stronger GDP growth, inflation and accommodating fiscal policy to support stable, income-driven returns from these essential assets.
SELECTED ALTERNATIVE STRATEGIES – RETURN ASSUMPTIONS (LEVERED,* NET OF FEES, %)

Transport:
Return projections are down slightly, but our outlook remains strong, driven near term by positive supply/demand conditions and longer term by these assets’ vital role in global economic growth.
SELECTED ALTERNATIVE STRATEGIES – RETURN ASSUMPTIONS (LEVERED,* NET OF FEES, %)

Commodities:
Return assumptions increase despite the past year’s substantial rise in commodity prices. We project a premium above inflation, on average, over the remainder of the cycle, yielding a strong full-cycle return. The return premium for gold vs. broad commodities narrows.
SELECTED ALTERNATIVE STRATEGIES – RETURN ASSUMPTIONS (LEVERED,* NET OF FEES, %)

Source: J.P. Morgan Asset Management; estimates as of September 30, 2020, and September 30, 2021.
* All return assumptions incorporate leverage, except for commodities, where it does not apply.
** The private equity composite is AUM-weighted: 65% large cap and mega cap, 25% mid cap and 10% small cap. Capitalization size categories refer to the size of the asset pool, which has a direct correlation to the size of companies acquired, except in the case of mega cap.
† Direct lending assumptions for 2022 and 2021 are not directly comparable. See footnotes in direct lending section for a detailed explanation.
†† The diversified assumption represents the projected return for multi-strategy hedge funds. The conservative assumption represents the projected return for multi-strategy hedge funds that seek to achieve consistent returns and low overall portfolio volatility by primarily investing in lower volatility strategies such as equity market neutral and fixed income arbitrage.
‡ U.S. core real estate in our assumptions comprises 90% prime high quality real estate assets and 10% value-added development assets. This exposure is consistent with the composition of the benchmark NFI-ODCE Index.
‡‡ Our 2022 assumptions are not directly comparable to our 2021 assumptions due to a change in methodology: For our 2022 estimates, to improve consistency across regions, we match the composition of European and Asia-Pacific core real estate to that of the U.S. (90% prime core and 10% value-added risk exposure). Previously, our European and Asia-Pacific core real estate assumptions included only prime core exposure.
This year, we combine previously separate assumptions, for European ex-UK and the UK, into our European assumptions for both core and value-added real estate.
As with core real estate, in 2022 we have combined two previously separate assumptions, European ex-UK and UK REITs, into a single European REITs assumption.
^ Asia-Pacific REITs follow a developed market construct and cover a slightly different geographic exposure from that of Asia-Pacific core real estate.
^^ The global composite is built assuming the following weights: roughly 60% U.S., 20% Europe and 20% Asia-Pacific.
Volatility and correlation: Stable forecast in a dislocated world: Risk outlook little changed, uncertainty rising
- The atypical market conditions created by central banks’ rescue interventions may increase the likelihood of extreme events and create sharp, short-term reversals in asset class correlations, adding greater uncertainty to our forecasts.
- Other than greater uncertainty, and greater risk of volatility spikes, our baseline volatility and correlation forecasts are broadly unchanged.
- Negative stock-bond correlations have been the norm over the past 20 years, and while we forecast a modestly negative correlation, we see less stability in this relationship, making it ever more important to consider other dimensions of portfolio risk – and to reduce reliance on fixed income as a portfolio hedge.
- This year, we explore an improved approach to forecasting private market volatility, an area in which proper measurement has long been controversial and subject to private markets’ lack of timely data, among other difficulties. We find that an approach that considers optionality offers insights and points to a partial solution.
The likelihood of large moves may be edging slightly higher
CHANGES IN RETURN DISTRIBUTION OF U.S. TREASURY BONDS, 2006–19 VS. 2020–21
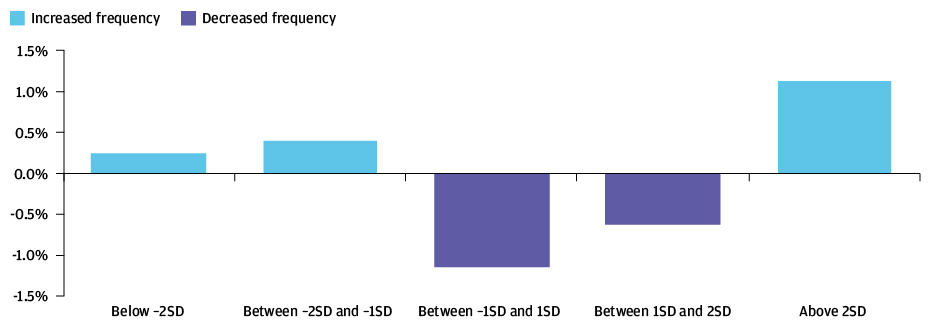
Source: Bloomberg, J.P. Morgan Asset Management; data as of August 30, 2021. Chart compares the difference between the probability distributions of 2006–19 and 2020–21.SD: standard deviation.
The 26th annual edition explores how the legacy of the pandemic – limited economic scarring but enduring policy choices – will affect the next cycle. Despite low return expectations in public markets, we think investors can find ample risk premia to harvest if they are prepared to look beyond traditional asset classes.

