Slide Image

Chart Image

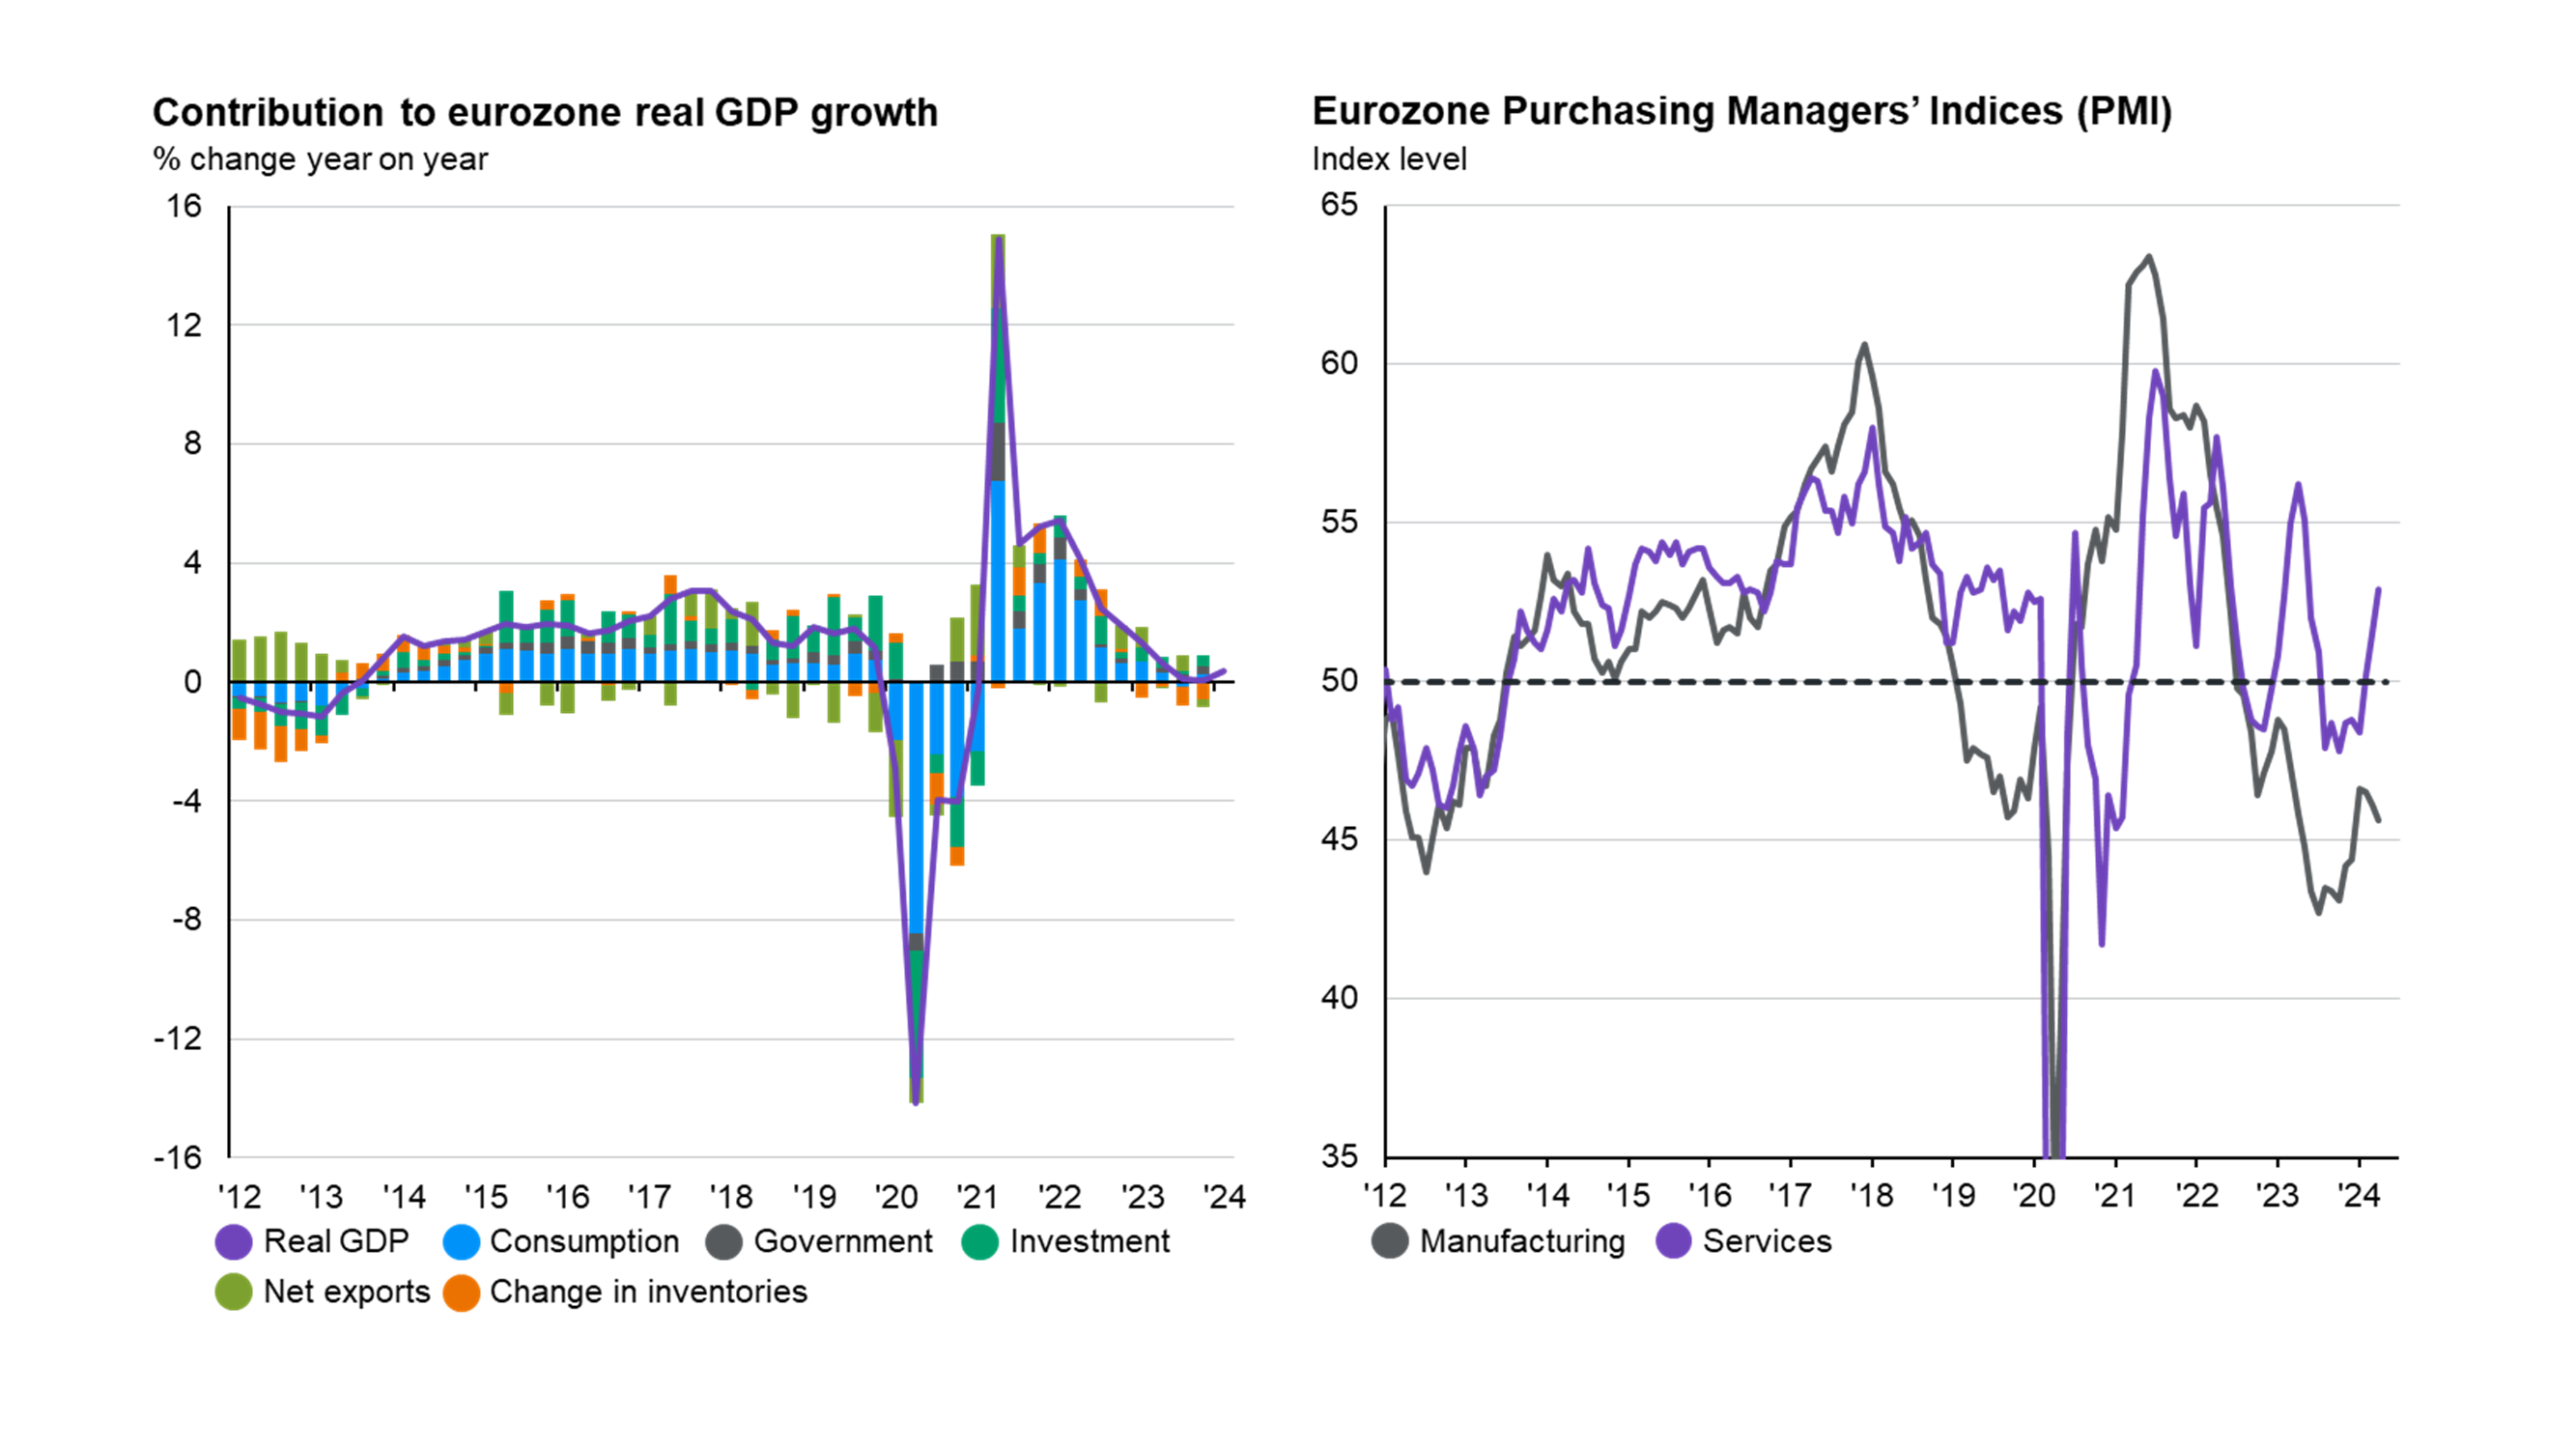
Eurozone Economic Monitor
This page takes the temperature of the eurozone economy. The chart shows a summary of five key indicators, and plots where the latest indicator readings rank by percentile relative to history. When the latest point is nearer the green area of the chart, this tells us that the indicator is nearer the higher end of its historical range of values. The chart also includes an 'elevated recession risk' flag that will show when the latest data is consistent with a value that has been observed at the onset of previous eurozone recessions.