Why value investing is poised to make a comeback in the 2020s
Updated as of June 15, 2020: As the value factor is mired in one of its worst drawdowns in history, we analyze its underperformance and explain why we think it is cyclical, not structural.
27-02-2020
Yazann Romahi
Garrett Norman
Gareth Turner
In Brief
- As the value factor is mired in one of its worst drawdowns in history, we analyze its underperformance and explain why we think it is cyclical, not structural.
- It matters greatly whether a value factor is constructed across or within sectors. Across sectors, the drawdown has lasted more than a decade. However when the value factor is constructed within sectors and avoids structural sector bets, the current drawdown cycle began just three years ago, in 2017.
- While the value factor might tend to underweight or short “disruptor” companies, the impact is modest and should not undermine the factor’s returns over the long term.
- Interest rate changes have historically been uncorrelated to future equity value factor performance and the shape of the yield curve has very limited ability to predict future returns of the value factor.
- Finally, we affirm our confidence in the value factor and suggest that some investors or asset allocators may want to consider increasing their value exposure.
Investors have long understood that paying a relatively low price for an asset tends to be a good starting point for generating outperformance in the future. This observation dates back to the seminal work of Benjamin Graham and David Dodd in the 1930s. The concept was further developed by the work of Eugene Fama and Kenneth French in the 1990s, which identified value as the academic factor that many investors now know. In their examination of the value effect since 1926, they demonstrated that an approach that systematically invested long cheap stocks and shorted expensive stocks would have generated a persistent stream of excess returns over the long run.1 Other academic work has refined the premise and practitioners of factor investing (including J.P. Morgan Asset Management) have written about the nuances of implementation.
The subsequent and widespread adoption of explicit factor-based approaches to investing has, however, coincided with a period of general weakness in the value factor’s performance. With the equity value factor mired in one of its worst drawdowns in history, many have begun to ask if the value factor has fundamentally changed and may be even be truly “dead” as an investment approach. Others dismiss such arguments and point to the recent stabilization in performance and the ever-increasing valuation gap between cheap and expensive stocks as potentially heralding better times ahead for systematic value investors.
As we have highlighted in our quarterly publications, the current value drawdown in essence reflects a re-rating of expensive growth companies relative to both the overall market and their value counterparts. In fact, following another leg down for the value factor in 2020, expensive growth companies are now trading at a 42% premium to their long-term average, while value stocks remain 14% “cheap” vs. their long-term average.2 A key question remains: Is this valuation differential relative to history in some way justified – in other words, will it “normalize” through a deterioration of value companies’ earnings growth and profitability, or will value stocks eventually rebound and outperform their expensive growth peers?
In this paper, we analyze the underperformance of the value factor and explain why we still have confidence in the factor’s efficacy over the long term, despite continued underperformance thus far in 2020.3 In short, we remain confident that value’s drawdown is a cyclical, not structural phenomenon. We make our case by analyzing four issues that are at the heart of the current debate about value factor investing:
- post-financial crisis performance
- measurement/accounting challenges
- sensitivity to “disruption” trades and the “new economy”
- low interest rate environment.
Finally, we consider value investing in a multi-factor framework and reaffirm our conviction that the value factor can play an important role in an investor’s portfolio, in isolation and particularly as part of a diversified multi-factor exposure.
Post-financial crisis value performance
Market participants and observers have focused on the value factor’s underperformance as a decade long phenomenon (that is, post-financial crisis), based on either the relative performance of value vs. growth indices or Fama and French’s own factor performance data. However, we believe that it is important to test the assumptions that underpin this conclusion. For example, one key question in defining or measuring a factor is whether to apply/construct the factor across or within sectors. In the across sectors approach, which is employed by both traditional value/growth indices and Fama-French, if one sector is structurally cheaper than another – e.g. financials or energy stocks are consistently cheaper than technology – that version of the value factor would be consistently biased towards financials or energy and away from tech.
In the within sector approach (sector-neutral), which we favor in both our long-only and long-short factor portfolios, “value” is determined by the cheapness of stocks relative to their sector peers (it ranks financials vs. other financials and tech stocks vs. other tech stocks), and can be captured without taking sector bets. While the two approaches are correlated to each other, they are not always the same – and, in fact, the within sectors approach tends to lead to higher returns and lower volatility over the long-term.4
Since 2017, there has been a significant performance differential between the two methodologies. While we see non-sector neutralized strategies suffering drawdowns in excess of 10 years, we conclude that the current drawdown cycle is much shorter, having only begun in January 2017. This is important in assessing the value factor’s performance relative to its own history: in this context, the current value drawdown, while severe, is less exceptional. Further, the two approaches (across and within sectors) may have very different prospects going forward – particularly if one believes that the economy has structurally changed , and that financials or energy companies will continually lag the performance of tech companies.
Severity of value drawdown is dependent on portfolio construction
EXHIBIT 1: LONG-TERM PERFORMANCE OF THE U.S. VALUE FACTOR (1990-2020)
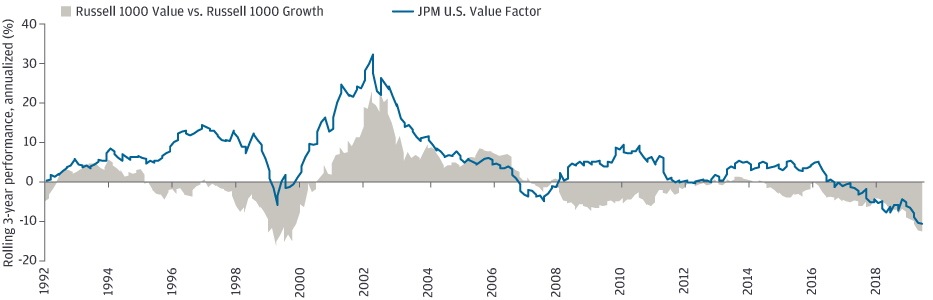
Source: J.P. Morgan Asset Management. For illustrative purposes only. As of April, 2020
Measurement and accounting challenges as examined in a sector-neutral approach
What metrics should we use to define a value stock? It’s not a simple question. Because companies now ascribe a much greater proportion of their overall value to intangible assets, some argue that ranking stocks on a metric such as price/book (the most commonly cited definition of the value factor) no longer works. We acknowledge potential limitations of the price/book metric, but it’s not the only way to determine whether a stock is rich or cheap. When we test the performance of various metrics while taking our favored sector-neutral approach, we see that the price/earnings metric (which is less effected by a company’s type of assets) has experienced similar levels of underperformance as price/book. Indeed, looking across a much broader set of potential value measures, including cash flow and sales-based measures of value, we see very consistent patterns of returns.5
We also observe that the current value drawdown is consistent across regions, despite different sector compositions, company profiles, and accounting standards. This supports the notion that the choice of value measurement essentially has no bearing on the value factor drawdown.6
Sensitivity to disruption trades and the new economy
Some investors argue that the value factor favors old economy companies and is thus susceptible to economic/market disruption, even when considering value in a sector-neutral manner.
This is not universally the case, however. For example, our sector-neutral methodology finds that name like Microsoft often ranks in the top quartile of stocks when sorted by the value factor. The same holds true for names like Cisco or Visa – and while stocks such as Apple, Google or Facebook are not quite as cheap, they tend to rank closer to the middle of our stock universe rather than to be outright expensive. While the value factor might indeed be underweight/short some disruptor companies, we believe that the impact is modest and should not undermine the factor’s returns over the long term. And in a multi-factor setting, the disruption issue is mitigated by the presence of quality and momentum factors. For example, a disruptor with positive momentum and reasonable quality can still score well in a multi-factor setting. Companies such as Amazon, Nvidia or Match suffer from extreme valuations but continue to generate strong revenues. Conversely, we see a different picture with disruptors such as Netflix, Tesla, or Uber, which rank poorly across both value and quality and either would not be owned, or may even be shorted in multi-factor portfolios. 7 8
We note another approach to adjusting for the bias against disruptors: neutralizing the investment universe based on descriptors of company characteristics, such as size, EPS growth or spending on R&D (measuring value of a company with low R&D spend relative to other companies with low expenditure as an example ). While this is an area that we do believe warrants further exploration, our current research indicates that the revised metrics would not change the fundamental conclusion that the value factor has experienced a genuine value drawdown since 2017.
The negative returns to equity value investing since 2017 are consistent, regardless of definitional metrics or regional applications
EXHIBIT 2: PERFORMANCE OF VALUE BASED METRICS, GLOBALLY AND ACROSS REGIONS
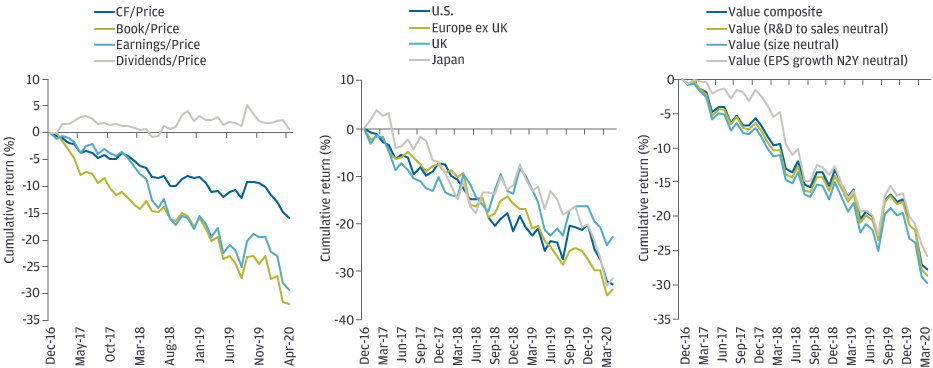
Source: J.P. Morgan Asset Management. For illustrative purposes only. As of April, 2020
Low interest rate environment
Some market participants have concluded that value cannot work in low interest rate environment - a concern that has been piqued by an emerging link between value’s performance and interest rates/the yield curve.9 Mechanically, the dividend discount model does present an argument that in a low interest rate environment, investors should be willing/able to pay more for future expected growth. This would be further reinforced in an environment where broad economic growth is relatively subdued.
To assess this proposition, we studied the predictive power of interest rate levels, interest rate changes, and the shape of the yield curve, looking across the U.S., UK, Europe, and Japan and considering periods both pre- and post-financial crisis. We found that interest rate changes were completely uncorrelated to future equity value factor performance, and the shape of the yield curve had very limited ability to predict future value factor returns. In addition, the relationship between the yield curve and future returns was inconsistent across time periods and regions. We would consequently be wary of relying on any tentative relationships from a portfolio construction perspective.
The long-term data demonstrates a clear lack of evidence in support of a link between value’s performance and the changes in the level of yields.
EXHIBIT 3: RELATIONSHIP BETWEEN THE FUTURE PERFORMANCE OF VALUE AND CHANGES IN THE YIELD ACROSS REGIONS
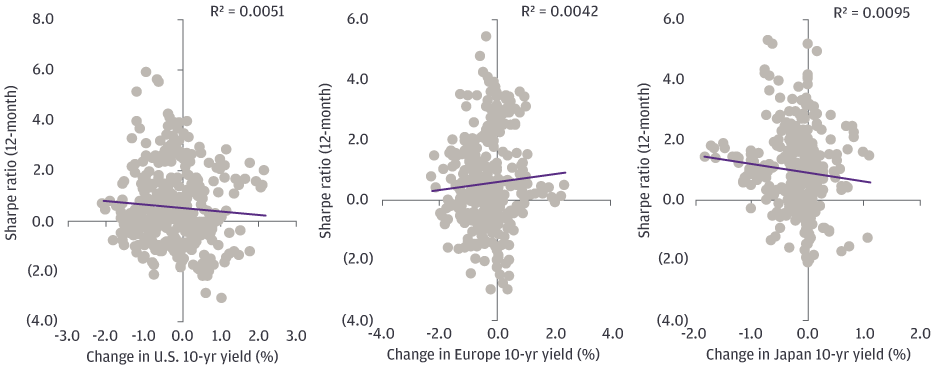
Source: J.P. Morgan Asset Management. For illustrative purposes only. As of April, 2020
Value performance in the presence of other factors
Of course, many investors are not applying the value factor in isolation and they are asking why the underperformance of value seems to have had such a significant impact on multi-factor strategies. Indeed, multi-factor performance has been underwhelming across the board over the past few years. As we have highlighted in previous publications, this value drawdown has been matched by a relatively modest performance from the equity momentum factor, which has historically acted as a robust buffer to value in a drawdown period.
What might explain that disconnect? As we consider potential causes of modest performance across a wide range of factors, we can identify a potential common headwind in the lack of breadth in the drivers of equity market returns. In Q4 2019, for example, a relatively narrow number of stocks delivered a significant proportion of equity market gains.10 As it happened, this was a very poor period for momentum-based investors (particularly in U.S. markets), and also not particularly helpful for value, despite the fact that the two factors are typically negatively correlated.11 While we don’t see the “disruptor” phenomenon as a major headwind to value investing, it may be that a mega-cap, winner takes all market presents a challenge for an investment approach that is premised on broader cross-sectional moves.
On a more positive note for factor investors, we are seeing greater differentials between stocks in the bottom and top quartiles of broader multi- factor portfolios. Indeed, the level of dispersion in multi-factor scores has not been seen since the dot-com boom. When investors begin to really focus on the divergence in fundamentals within equity markets, we believe that it will lay the groundwork for a period of potentially significant positive performance.
EXHIBIT 4: MULTI FACTOR DISPERSION (1990-2019)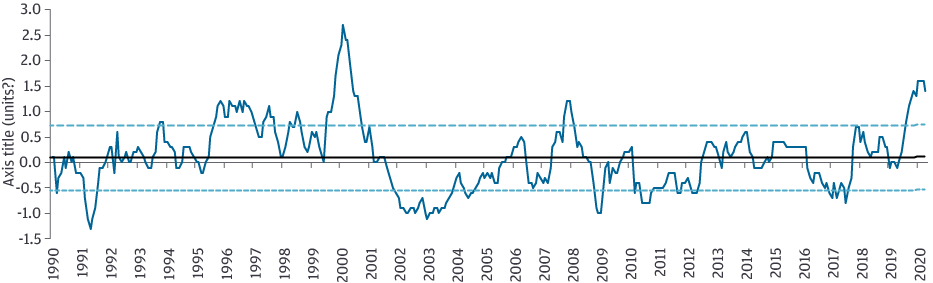
Source: J.P. Morgan Asset Management. For illustrative purposes only. As of April, 2020
Conclusion
In assessing the future validity of factors, we believe that it is always important to understand any potential economic justifications for the factors’ existence. While it is always possible that “this time is different,” our review of value factor underperformance has not cracked our confidence in the factor. Value’s extended drawdown may reflect investors’ ambitious expectations for growth stocks (which by and large were met early on in 2017/2018); however, we do not see this performance as fundamentally justified since then. Of course the behavioral argument supporting value investing is that expected growth rates are ultimately over-extrapolated and eventually trigger a reversal in favor of value stocks. We continue to advocate investor patience, with a focus on building portfolios strong enough to weather varied market environments. In a contrarian spirit, some investors or asset allocators may even want to consider increasing their exposure to the value factor.
1 Fama and French revisited their initial research in “The Value Premium” (January 2020), and while they acknowledge a decrease in excess returns in the second half of the period from 1963 – 2019, they are unable to conclude that this decrease is statistically significant.
2 See Q1 2020 Factor views. Expensive growth stocks were trading at a 20%-30% premium for much of 2019 and grew even more richly priced in 2020.
3 The value factor suffered one of its worst months on record in March 2020 (the third worst dating back to 1990) and has continued to underperform since then. The lack of change in stock market leadership through what was the fastest forming bear market in the past 90-plus years (data from 1926 – 2020) and the subsequent recovery has been surprising. However, it does not invalidate the conclusions of this paper and in many ways we see this year’s price action as a mere extension of the mispricing that we have observed in recent years.
4 In an analysis over a broad universe of U.S. stocks from 1990 – 2019 a version of value that looked within sectors outperformed one that was not sector neutralized by 59bps (10.73% annualized return vs. 10.14%), while exhibiting lower volatility (13.99% vs. 14.26%).
5 The one value factor we have found to have held up better has been dividend yield, perhaps unsurprisingly given an environment where the search for yield remains a significant investor theme.
6 Value performance has been worse in the U.S. thus far in 2020, though this was driven by performance in January when U.S. equities were continuing their climb, rather than in the ensuing bear market.
7 Further supporting the weakness of this hypothesis is the fact that approaches that abandon the sectoral definitions altogether and instead employ statistical approaches such as “clustering analyses” to identify groups of stocks with common characteristics seem to have struggled to a similar extent
8 This multi-factor perspective has also proven beneficial when analyzing the potential impact of themes associated with COVID-19, which considers the factor score of stocks that are expected to benefit from structural changes accelerated by the coronavirus relative to names that may be negatively impacted or left behind.
9 See Q1 2019, Q2 2019, and Q3 2019 Factor Views
10 In Q4 2019, 8 of the 10 largest stock in the Russell 1000 drove one third of the index’s total return. We have seen similarly concentrated performance since 2017.
11 Using our own factor definitions, the US momentum factor was down -4.5%, while value was flat and quality lost -2.6% in Q4 2019.
0903c02a8282d76b