
Emerging Markets Debt – Time to Buy?
02-04-2020
Zsolt Papp
“Buy when there is blood in the streets”
This quote is attributed to Baron Nathan Mayer Rothschild (1777-1836) and although there is no evidence that he actually said it, it has entered financial market folklore. Looking back at the past six weeks, there can be little doubt that a lot of blood (metaphorically) has been spilled. And as much as one wishes one could say that this time was different, it both looked and felt awfully familiar for investors in EMD. Spreads widened, prices dropped, investors redeemed money and perma bears had their field day.
EM Sovereign composite spread (bps) close to peak?
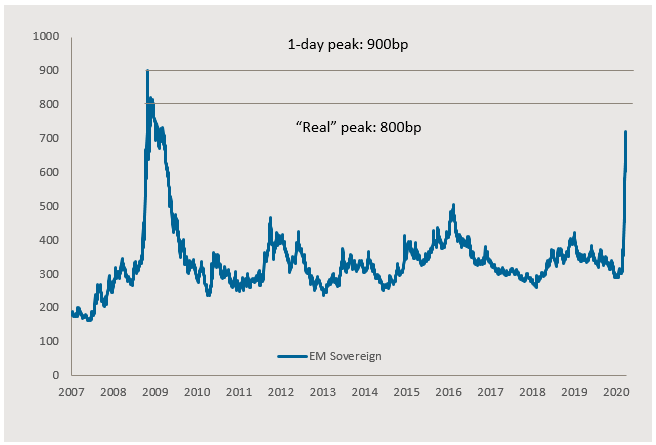
Source: Bloomberg, JPMAM, Data as at 27.03.2020. JPM EMBI Global Diversified
Is this time any different?
As the chart above shows, the EM sovereign bond spreads widened to around 700bp in late March from a low of 300bp in early February. This is not quite as high as during the global financial crisis (GFC), but the chart also shows that this was a one-day event (23rd October, 2008). It briefly recovered to 640bp then sharply widened back to 800bp and subsequently settled around that level for about one month. After that it started to decline, initially at a relatively leisurely pace but it rapidly accelerated after another 10 weeks. The post-double-dip peaked was therefore around 800bp.
This time, it has not (yet?) reached the either of the two peaks, which suggests that we could see more spread widening, at worst as much as up to 150-200bp. However, there is good reason to believe that spreads could be closer to the peak than history suggests. So what is different? First, this is not a financial sector crisis, in contrast to 2008. The spread widening in 2008 was driven by the fear that the global banking and credit system was broken and that practically nobody could get financing. This time the banking system works reasonably well, no major financial institution is in distress, and the ability to provide credit remains intact.
US Financial Conditions less stressed than in 2008
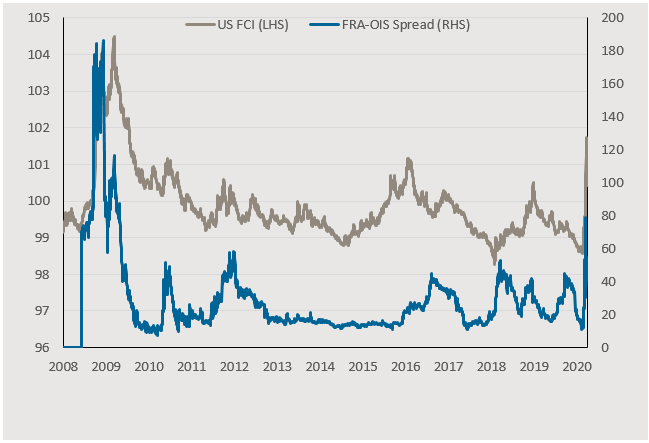
Source: Bloomberg, JPMAM, Data as at 31.03.2020. GS US Financial Conditions Index
Admittedly, there has been some stress in the financial system, as illustrated by the FRA-OIS spread in the chart above. However, the current level of 47.5bp is significantly below levels seen during the GFC period and while additional spread widening cannot be ruled out, central banks are much more sensitive to liquidity in the banking system than pre-GFC. In 2008, stock markets started to fall in June but central banks waited until September with the first cuts (the ECB actually even hiked rates in July). This time the reaction gap was only four weeks and much broader across DM and EM central banks.
The latter is particularly important because it underpins that EMs are in much better shape than in 2008 or in 2013 (remember the taper tantrum?). Numerous EM central banks have already cut interest rates this year, including the People’s Bank of China (PBOC), Reserve Bank of India (RBI), Banco de México (Banxico), Banco Central do Brasil (BCB) and Bank of Russia (CBR).
The fiscal policy response has been also much faster and bigger than during GFC. The US alone have announced a fiscal package of 5.7% of GDP and Germany and the UK have presented similarly large stimuli. EM countries are also implementing sizeable fiscal packages as the measures announced so far amount to 2.25% of EM GDP.
All good then?
It could be concluded from the above that such measures should lead to a sharp rebound in economic activity. But the painful and often repressed memory from previous crises is that recoveries are rarely walk in the park. Economists expect the worst recession since WWII and as the disruption caused by COVID-19 is deeper and more global on reach than previous similar events it could take longer to make up production losses.
Inevitably, defaults will rise in such a scenario, but the interesting question is by how much. Analysts are now expecting Global HY defaults to rise to 6-8% and EM HY to around 5% (CIB research doubled the forecast to 4.8% from 2.4%). The region most at risk is Middle East & Africa due to large size of the oil & gas sector. Analysts expected the default rate to increase to 7.2% from 1.6% in 2019. However, Latin America (2.3% => 5.4%), Asia (1.6% => 4.0%) and EM Europe (0.0% => 4.0%) are also forecast to suffer significant increases in defaults.
HY corporate default rates (%)
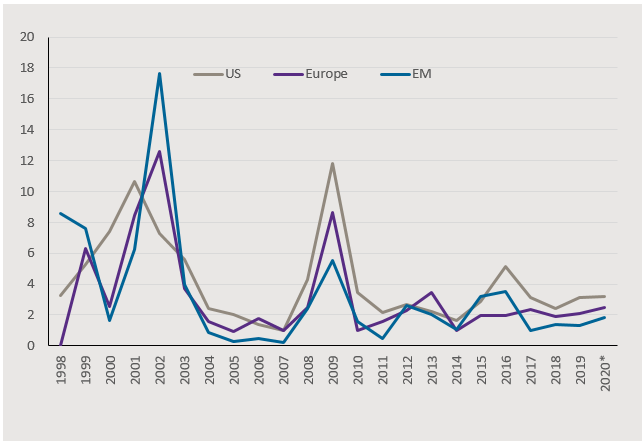
Source: Standard & Poor’s, *Data as at 23.03.2020
Some readers might be surprised that the forecast for EM is less bad than for Global HY, but this is actually in line with historical data. Except for 2002, which was a bit of an “annus horribilis” for EM, mainly because of the impact of Argentina’s sovereign default on the corporate sector, default rates have been similar or lower than in the US or Europe. Credit fundamentals also support the better outlook for EM corporates. Going into this crisis, leverage metrics for EM corporates were significantly better than for DM. Net leverage, for example, for EM HY stood at 3.2x vs 4.0x for US HY and interest coverage at 5.3x compared to 4.5x.
Sovereign credit quality is also likely to suffer, not only from lower growth but also from generous fiscal packages. Most EM countries have sufficient financial space to implement these stimuli (eg local market funding, bi or multilateral sources, savings) and as bond markets recover, access to refinancing should become available again. In some cases, though, the IMF will probably have to step in to avoid current account crises and help organise orderly debt restructurings.
The good news is that the IMF has substantial financial firepower. Total financial sources amount to around SDR 975bn (USD 1.3trn) of which SDR 715bn are available for lending (the rest is set aside as a liquidity buffer). Current IMF credits amount to SDR 117bn, which leaves SDR 598bn (USD 815bn) for additional lending to countries in need.
Is it time to buy?
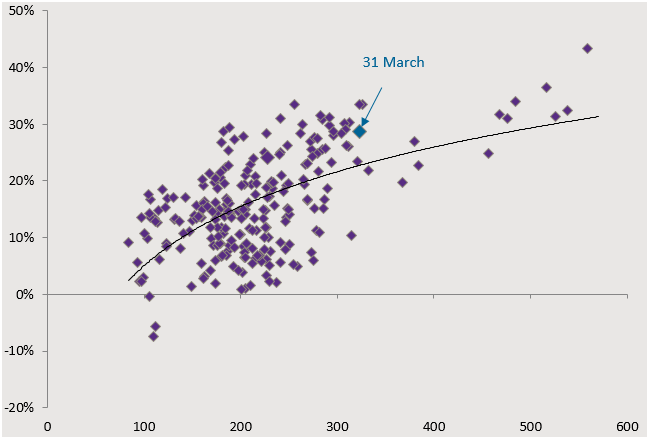
Investors sensitive to market timing should consider the risk of a double dip. We have seen it in the GFC and cannot rule it out from happening again. For investors taking the longer term view, however, the chart below could provide the answer.
Based on historical data, current spread level suggests ~30% return in next 24 months for EM debt
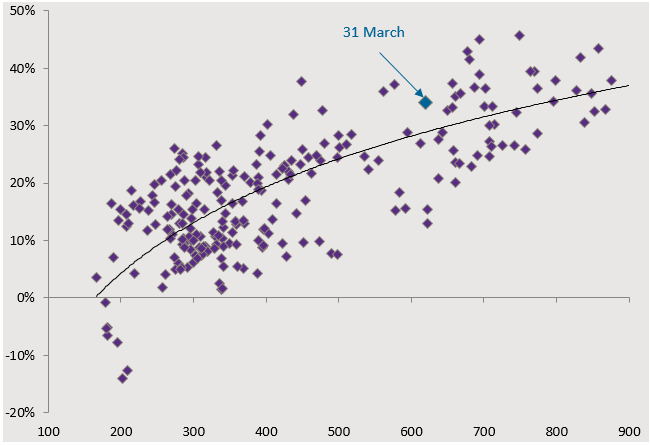
Source: Bloomberg, JPMAM, Data as at 31.03.2020. JPM EMBI Global Diversified spread and return
The last four weeks have created deep value and at current levels EM debt has historically returned more than 30% over two years. In addition, two-year returns have always been positive. Investors may well be able to still enter the market at similar levels in a couple of weeks and perhaps spared themselves the pains of a double-dip. However, gradually building up positions enables investors to participate in a rally without having to chase it after it has started.
There is also a less risky alternative from a credit perspective. The sell-off has also created deep value in EM Investment Grade, as the spread has widened to 330 basis points. As the chart below shows, returns at these spread levels have been around 20% over two years. In addition, default rates have been historically very low. The latest high for BBB- rated EM IG corporates was in 2008 with 1% and the median default rate stands at 0% according to S&P.
Low credit risk alternative: EM Investment Grade also offers double-digit returns at current spread levels
Source: Bloomberg, JPMAM, Data as at 31.03.2020. JPM EMBI Global Diversified Investment Grade spread and return
Let me end this blog on another quote attributed to Baron Rothschild: “buy on the sound of cannons, sell on the sound of trumpets”. I am quite certain that we haven’t yet heard the trumpets, but the last few weeks did sound very much like cannons to me.