What is “normal” for long term Treasury yields?
After a period of historic stimulus, the era of financial repression is coming to an end which means more income for bond investors over the longer term.
09-11-2023
By Kelsey Berro with contributions from
Priya Mira
David Rooney
Evan Olonoff
Edward Fitzpatrick
At our most recent GFICC Investment Quarterly (IQ)1 meeting in September, we judged that the Federal Reserve (Fed) was near the end of its hiking cycle as the trend for wages and inflation improved. Despite recent resilience in growth, we believed the downside risks remained material given the long and variable lags of monetary policy. While the terming out of debt by households and companies in the aftermath of COVID may delay the impact of higher rates, it does not eliminate them. Overall, we viewed the odds as evenly split between soft and hard landing. Given this outlook, we expect 10-year Treasury yields to move lower in the next three-six months to a range of 3.5 - 4.0%.
While in the short-term we would expect the primary driver for interest rates to be cyclical factors, in this blog we will dig into the structural factors we believe will drive yields over the medium term. For this exercise, we loosely define medium-term as five years ahead. It is important not to lose sight of some key longer-term dynamics that will influence rates over the medium-term.
To understand where we are going, we will start with how we got here, as seen in Figure 1. In short, the post COVID burst of fiscal stimulus starting during the pandemic has unlocked USD 5 trillion in excess growth and pulled forward five-years’ worth of spending. While initially this government support was justified, the last two years of initiatives look excessive given the current state of the economy.
Figure 1: Spending Brought forward during Covid response (Billions, USD)
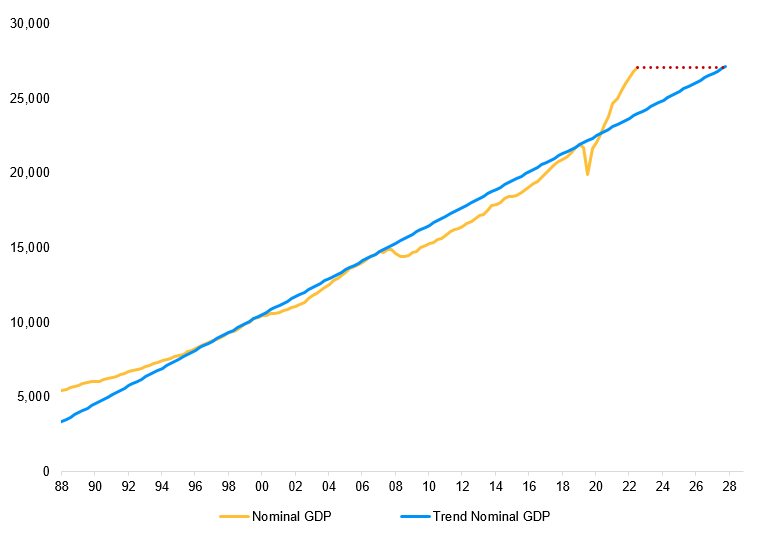
Source: JPMorgan Asset Management, Bloomberg, BEA; Data thru Q2 2023.
In hindsight, monetary policy was also too accommodative for too long after the pandemic recovery had begun. While the Fed has since been aggressive in re-setting the policy rate higher, they were initially slow to respond to higher inflation and didn’t begin hiking until March 2022 when core CPI had accelerated from 1.6% to 6.5% over the prior 12 months. Note that the Fed was buying bonds via quantitative easing (QE) until March 2022. The combination of easy fiscal and monetary policy has been record setting with the level of stimulus (even exceeding the WWII period), as seen in Figure 2.
Figure 2: Fiscal and monetary support as a % of GDP
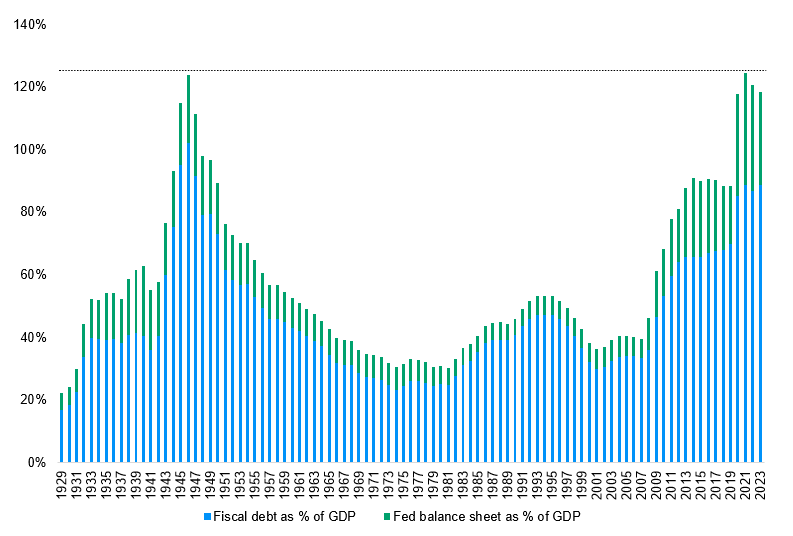
Source: JPMorgan Asset Management, Bloomberg, Census Bureau, BEA; Data thru Q2 2023.
The result of unprecedented stimulus has been a period of high nominal growth but only trend-like real growth, as seen in Figure 3. While the annualized pace of nominal growth in the last two years has been 6.4%, real growth has been just 2%. This is a disappointing result for those hoping for more signs that productivity had accelerated because of proactive fiscal policy.
Figure 3: Real GDP versus the prevailing trend (Billions, USD)
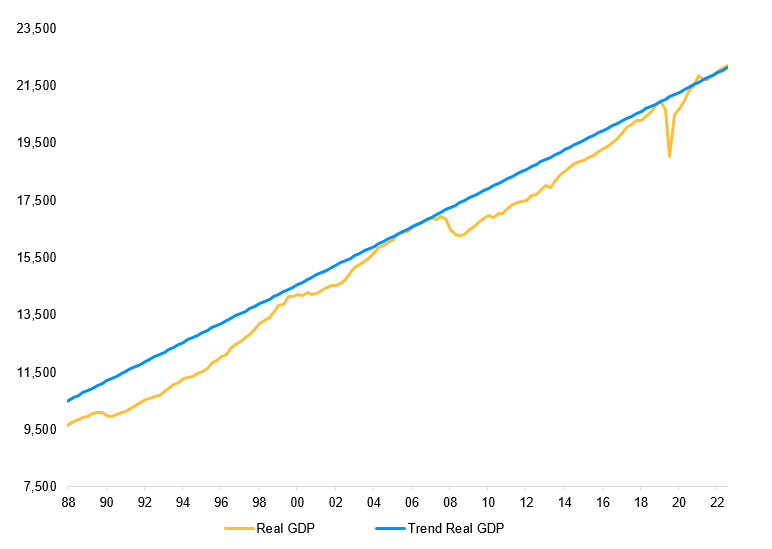
Source: JPMorgan Asset Management, Bloomberg, BEA; Data thru Q2 2023.
Higher inflation over time, which is the by-product of excessive stimulus, will impact long-term rates. While inflation has broken above the 40-year trend as seen in Figure 4, inflation expectations have remained reasonably well behaved so far. That being said, long periods of above target inflation can move expectations higher.
Figure 4: 5 Year Annualized Headline CPI
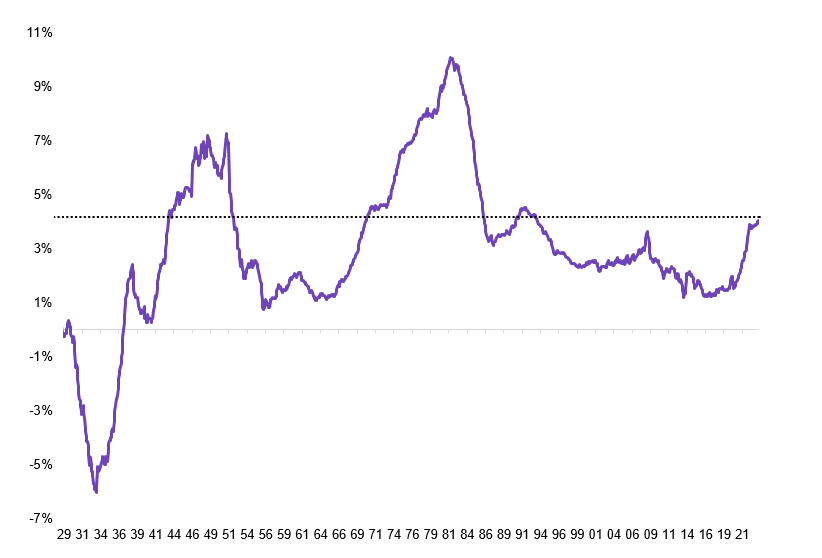
Source: JPMorgan Asset Management, Bloomberg, Bureau of Labor Statistics; Data thru 9/30/23.
Over the medium term, deglobalization and demographics will add upward risks to inflation. For example, geopolitical risks are resulting in a reshoring of manufacturing activity for security reasons even if costs are higher. We find an inverse relationship between trends in trade volumes and core goods prices. As trade volumes have slowed since the global financial crisis, core goods prices have risen, as seen in Figure 5. On the topic of demographics, millennials are reaching a stage in their lifecycle when spending accelerates as family formations rise, another structural boost to demand and prices.
Figure 5: Global Trade Volumes versus Core Goods Inflation
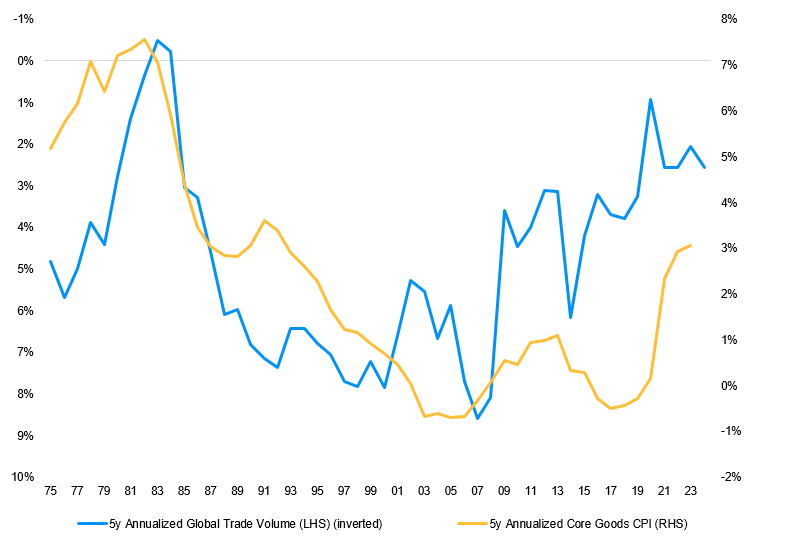
Source: JPMorgan Asset Management, Bureau of Labor Statistics, OECD; Data thru 9/30/23.
We believe Fed policy rates may be at an inflection point after a long stretch of “lower, highs” and “lower, lows” for policy rates. The Fed has already raised the policy rate significantly higher than the last tightening cycle (which ended at just 2.38%). In the next easing cycle, we do not expect the Fed to return to the zero lower bound (ZLB) and this will have important knock-on implications. First, we expect the average Fed Funds rate over a cycle should be higher. Second, with structurally higher inflation and the Fed no longer constrained by the ZLB rate, it is unlikely the Fed will be doing QE in the next cycle. Third, forward guidance, which was introduced to manage the policy rate when constrained at zero, should also be less used.
In a world where the Fed does not return to ZLB in the next easing cycle nor use QE, a significant price insensitive buyer (the Fed) will be missing from the Treasury market, as seen in Figure 6. Term premium, a description for the additional yield compensation investors demand that can’t be explained by the fundamentals (inflation, growth, Fed), is likely to be higher. The less captive, private sector will be the marginal buyers of Treasuries but likely at a higher yield and a steeper curve.
Figure 6: Percent of Treasury holdings by price insensitive buyers
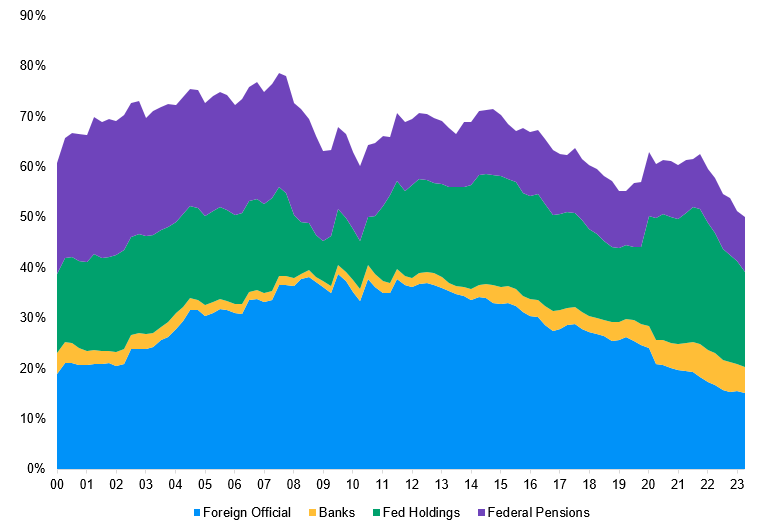
Source: JPMorgan Asset Management, Bloomberg, US Treasury; Data thru Q2 2023.
Private sector buyers include mutual funds, ETFs, private pension funds, private foreign investors, liability-driven investments (LDI) and households. They have stepped up and increased their holdings to more than USD 12 trillion — accounting for almost half of the outstanding marketable debt. Investors parked in cash could also extend into the Treasury market with USD 5.6 trillion currently held in money market funds.
While our cyclical outlook suggests lower yields ahead, we have built a five year range of illustrative outcomes for the 10-year US Treasury yield, as seen in Figure 7. The estimates show a yield low that is significantly higher than the 50bps that was reached in the depths of the COVID crisis (10-year US Treasury yields reached an intraday low of 31bps on March 9, 2020). The upper end of the range is also much higher than we have experienced since the Volcker-induced multi-decade disinflation of the late 1980s / early 1990s.
This yield range, while not a near term forecast, allows us to better understand a variety of possible outcomes driven by factors beyond the cyclical developments. After a period of historic monetary and fiscal stimulus resulting in higher inflation, the Fed is less likely to be constrained by ZLB rate and the average fed funds rate over a cycle should be higher. Term premium will need to rise as private sector, price sensitive buyers replace price insensitive ones including the Fed.
The era of financial repression is coming to an end which means more income for bond investors in real and nominal terms. This will allow bonds to revert to their traditional role as a ballast within portfolios over the longer term.
Figure 7: Outlook for 10-year US Treasury Yield
Five Years Ahead |
Fed Funds Rate |
10-Year UST Yield |
Rationale |
Build Up to 10-year UST Yield |
||
Expected 10-year Real Policy Rate |
Expected Inflation over 10-year |
10-year Term Premium Estimate |
||||
Base-case |
4 – 4.5% |
5.0% |
Sticky inflation (modestly above 2%) & higher deficits |
2.0% |
2-2.5% |
0.8% |
Lower |
2.5% |
2.5% |
Low Growth, Mild inflation & financial repression |
0.5% |
2.0% |
0.0% |
Upper |
6.50% |
7.5 – 8.5% |
High Inflation, Tight policy & 80’s style uncertainty |
2.5% |
4.0% |
1-2% |
Source: JPMorgan Asset Management; As of November 2023.
1 Every quarter, lead portfolio managers and sector specialists across J.P. Morgan’s Global Fixed Income, Currency & Commodities platform gather to formulate our consensus view on the near-term course (next three to six months) of the economy and fixed income markets.
094v230611175547