Slide Image

Chart Image

UK Bank of England policy
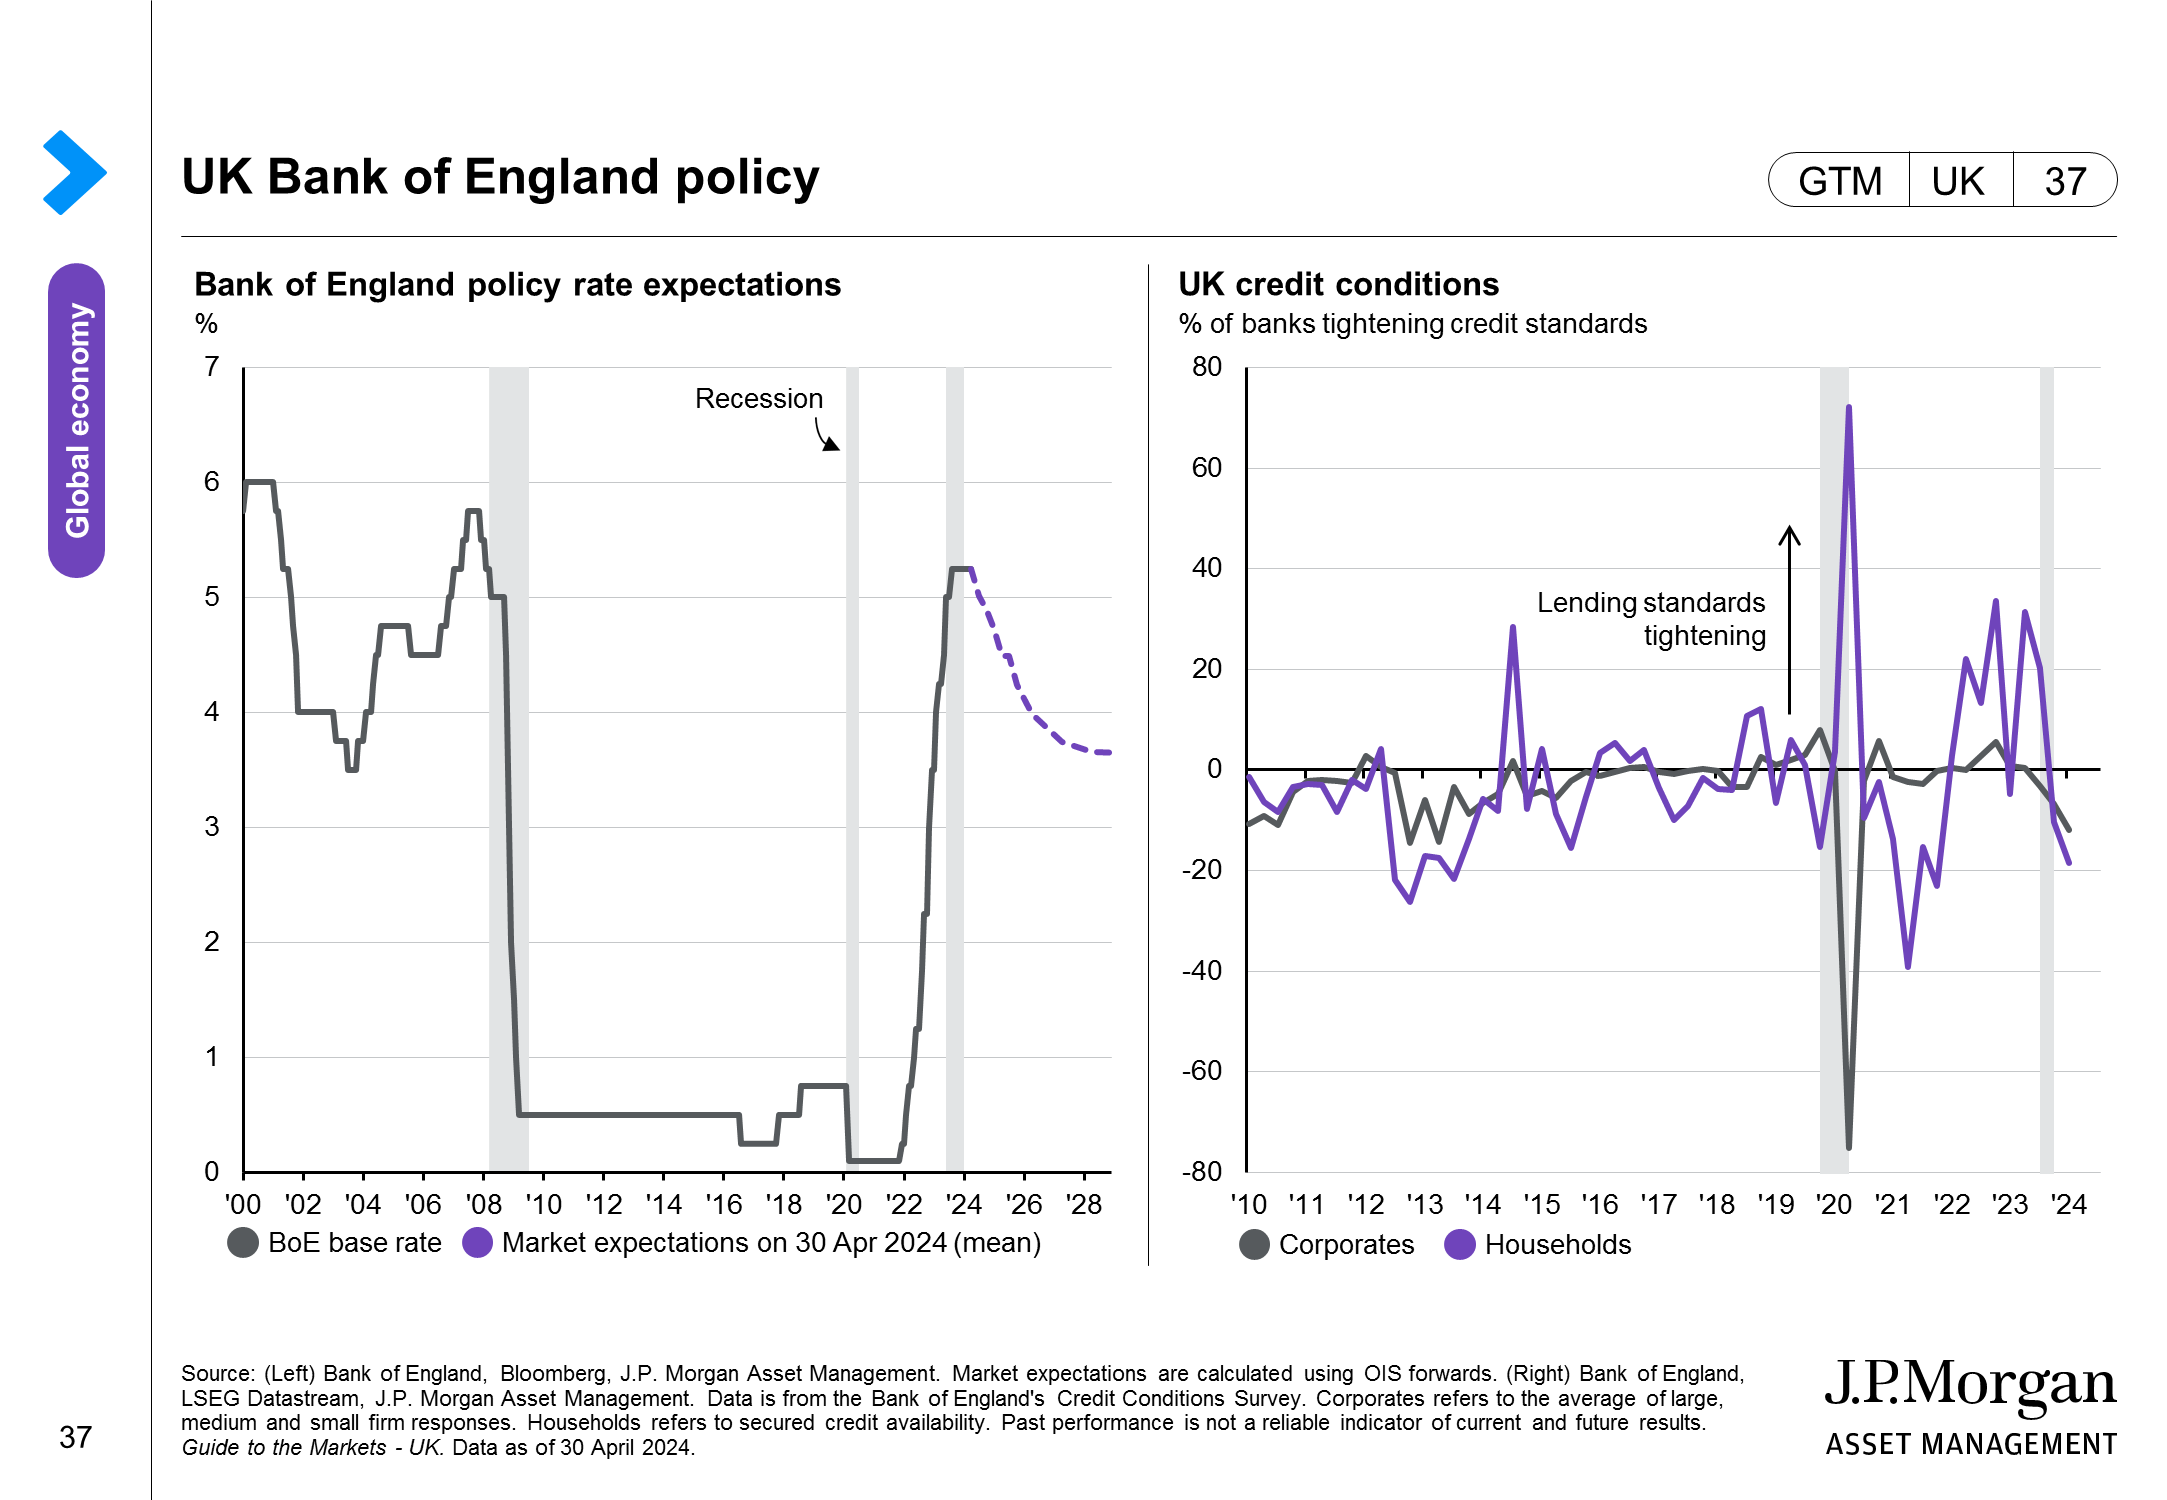
This page focuses on the Bank of England. The left-hand chart shows historical policy rates along with market expectations for the policy rate going forward, which are calculated using the sterling OIS forward curve. The right-hand chart plots the percentage of banks tightening lending standards over the past 3 months.