Slide Image

Chart Image

UK Bank of England policy
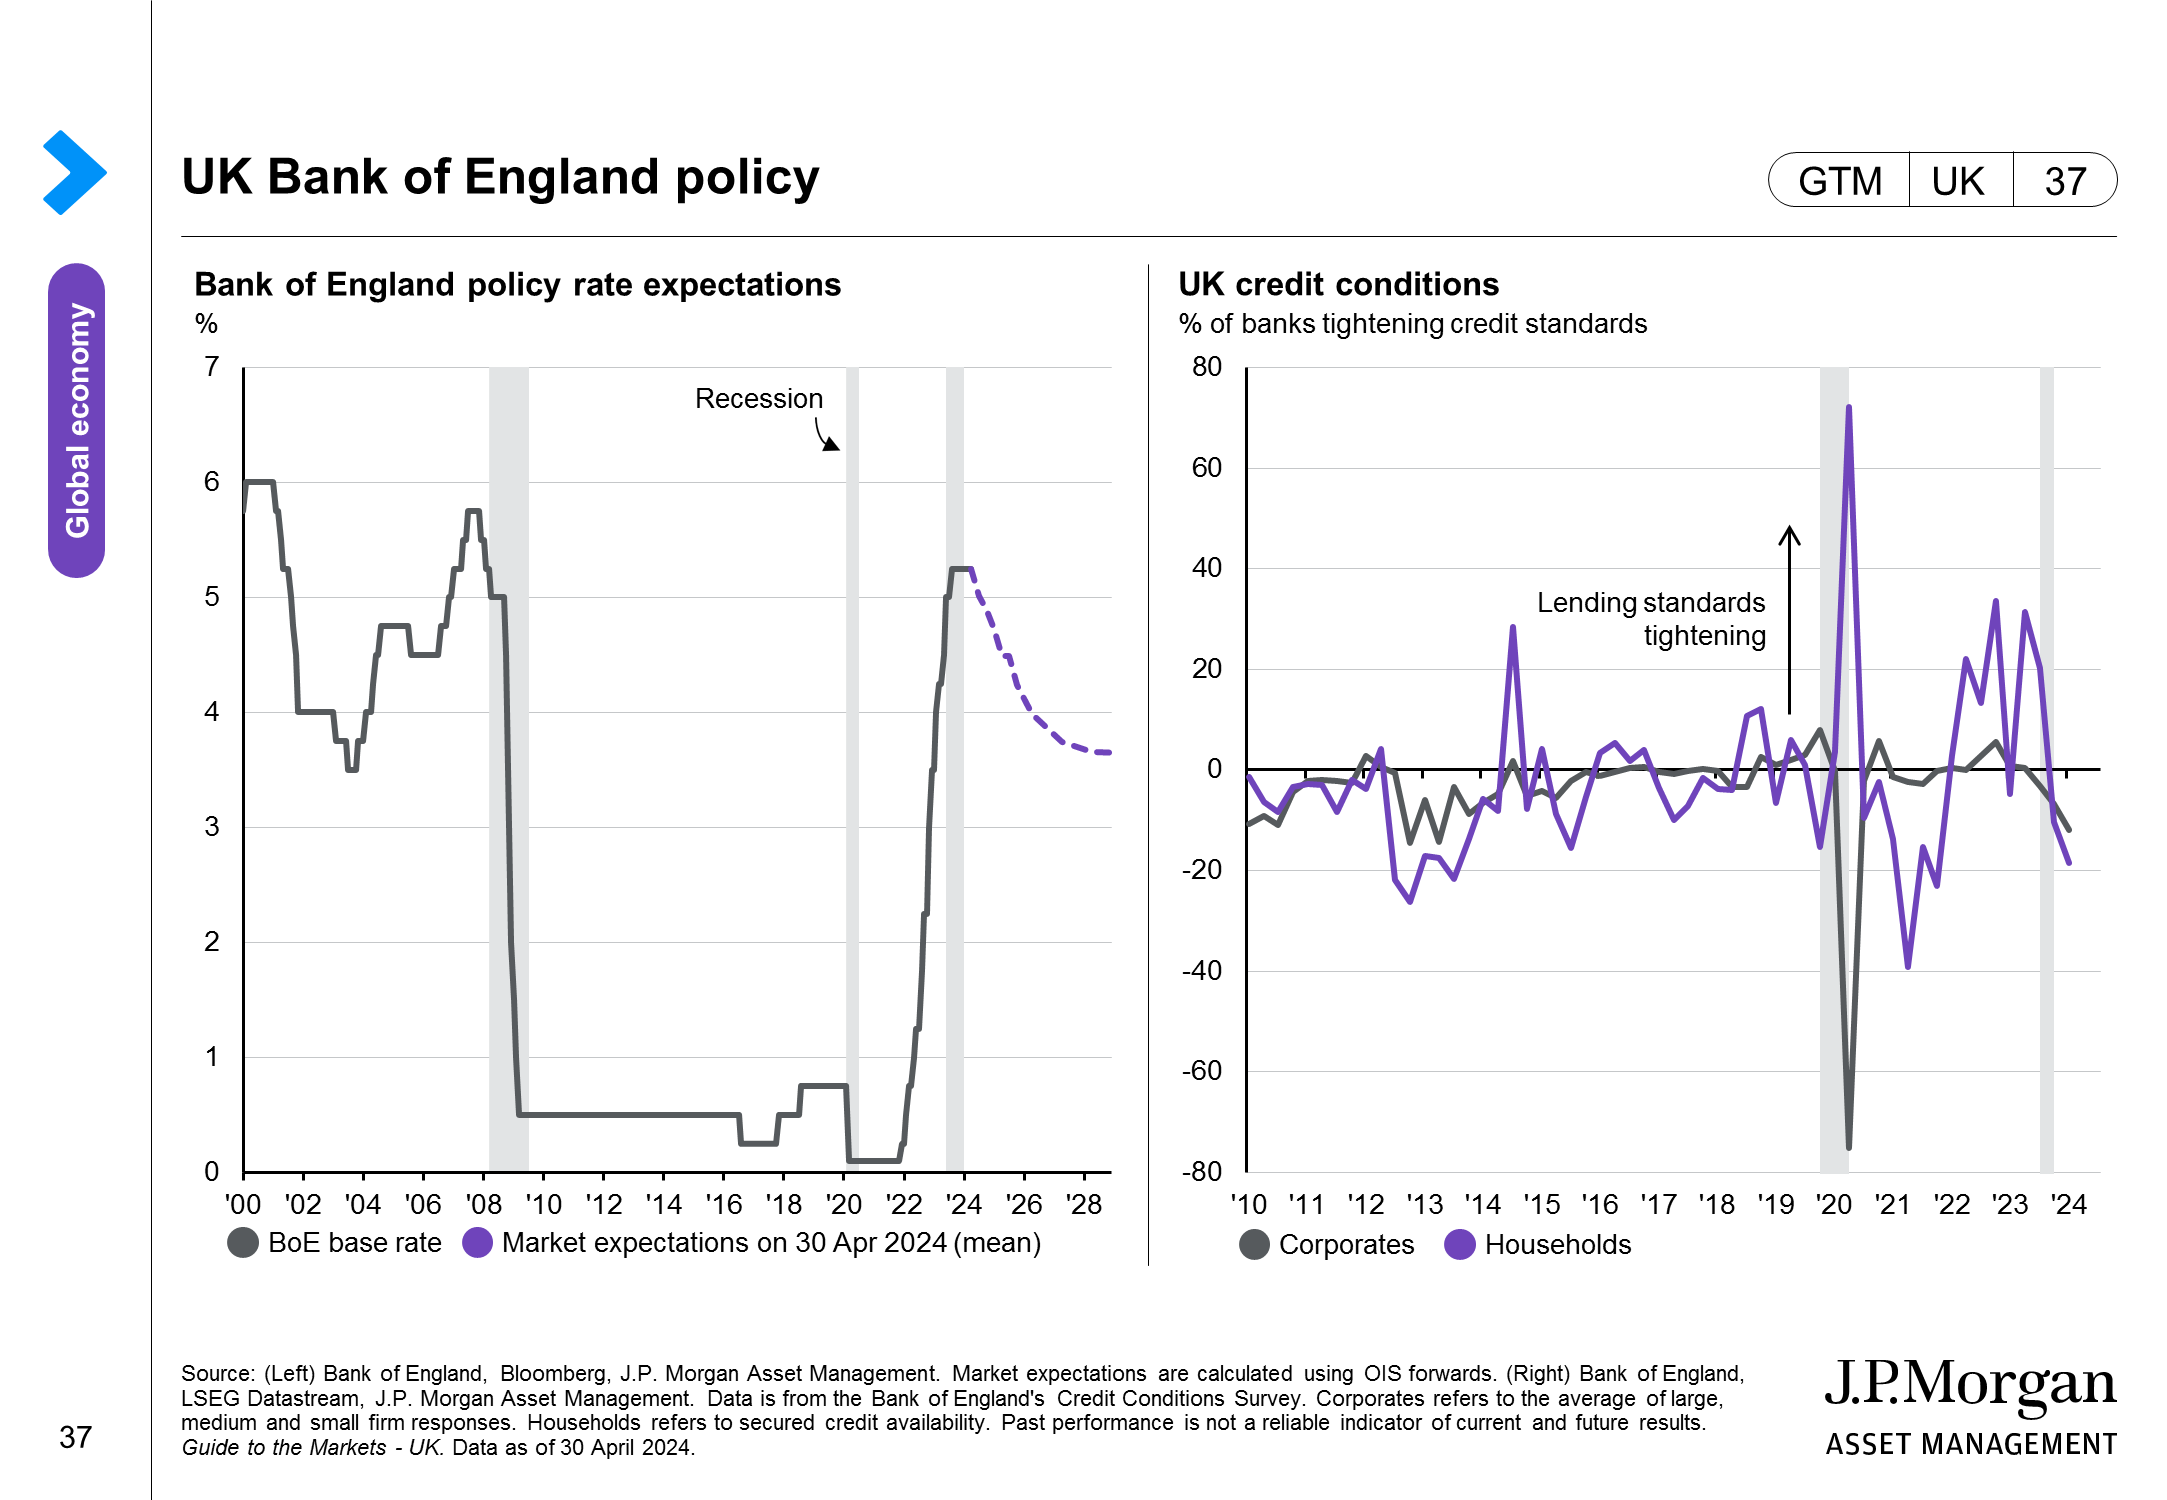
This page focuses on the Bank of England. The left-hand chart shows historical policy rates along with market expectations for the policy rate going forward, which are calculated using the sterling OIS forward curve. The right-hand chart plots the evolution of fixed vs. floating mortgages in the UK since 2016. Many more consumers now hold fixed rate mortgages relative to floating, which should reduce the sensitivity of UK households to interest rate increases.