Slide Image
Global government debt
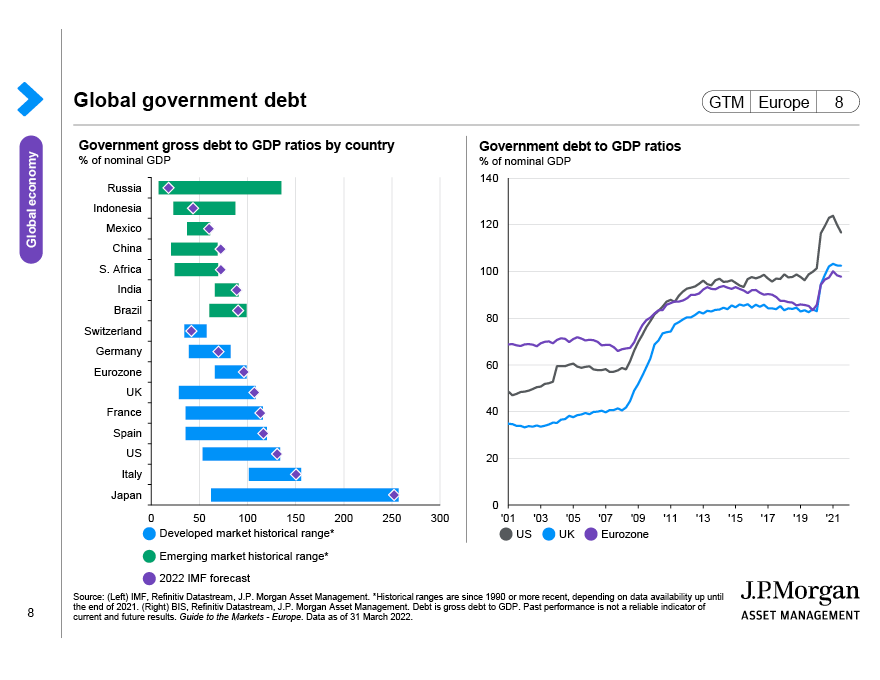
This page looks at the evolution of government debt. The left-hand chart shows debt-to-GDP ratios for developed and emerging markets, highlighting the rapid expansion in government debt levels during Covid-19 in comparison to previous shocks. The right-hand chart looks more granularly at gross debt-to-GDP ratios across different countries.