Slide Image

U.S. real estate: Residential
In this slide, we take a closer look at the residential real estate environment in the United States.
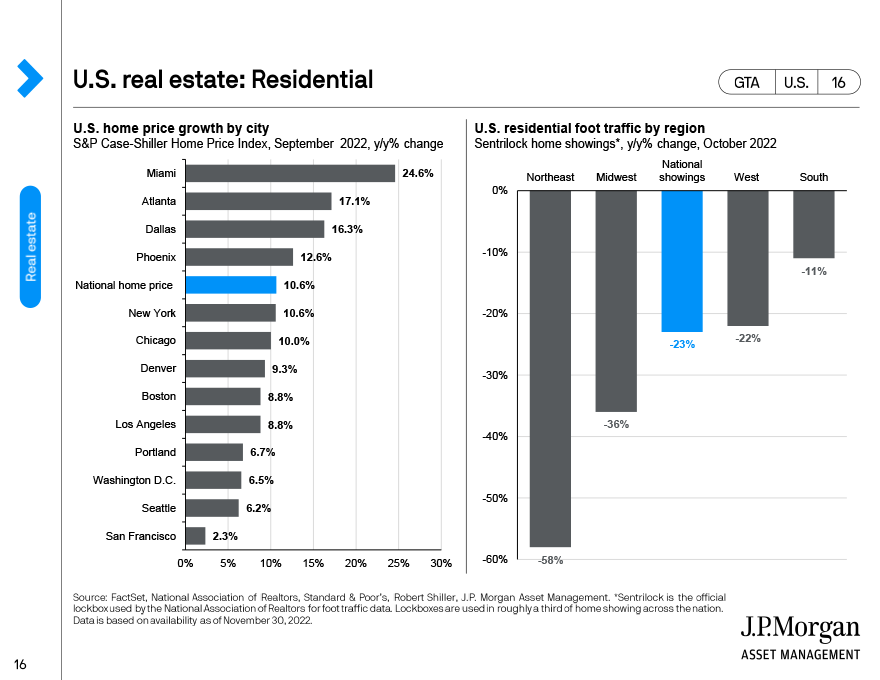
On the left-hand side, we illustrate the year-over-year in home prices by city along with the national index to show which cities are trending above and below the national average.
On the right-hand side, we show residential foot traffic by region. As you can see, the latest data points to sharp y/y declines across all regions, with the northeast and midwest seeing the largest decreases.