Slide Image

Chart Image

Oil
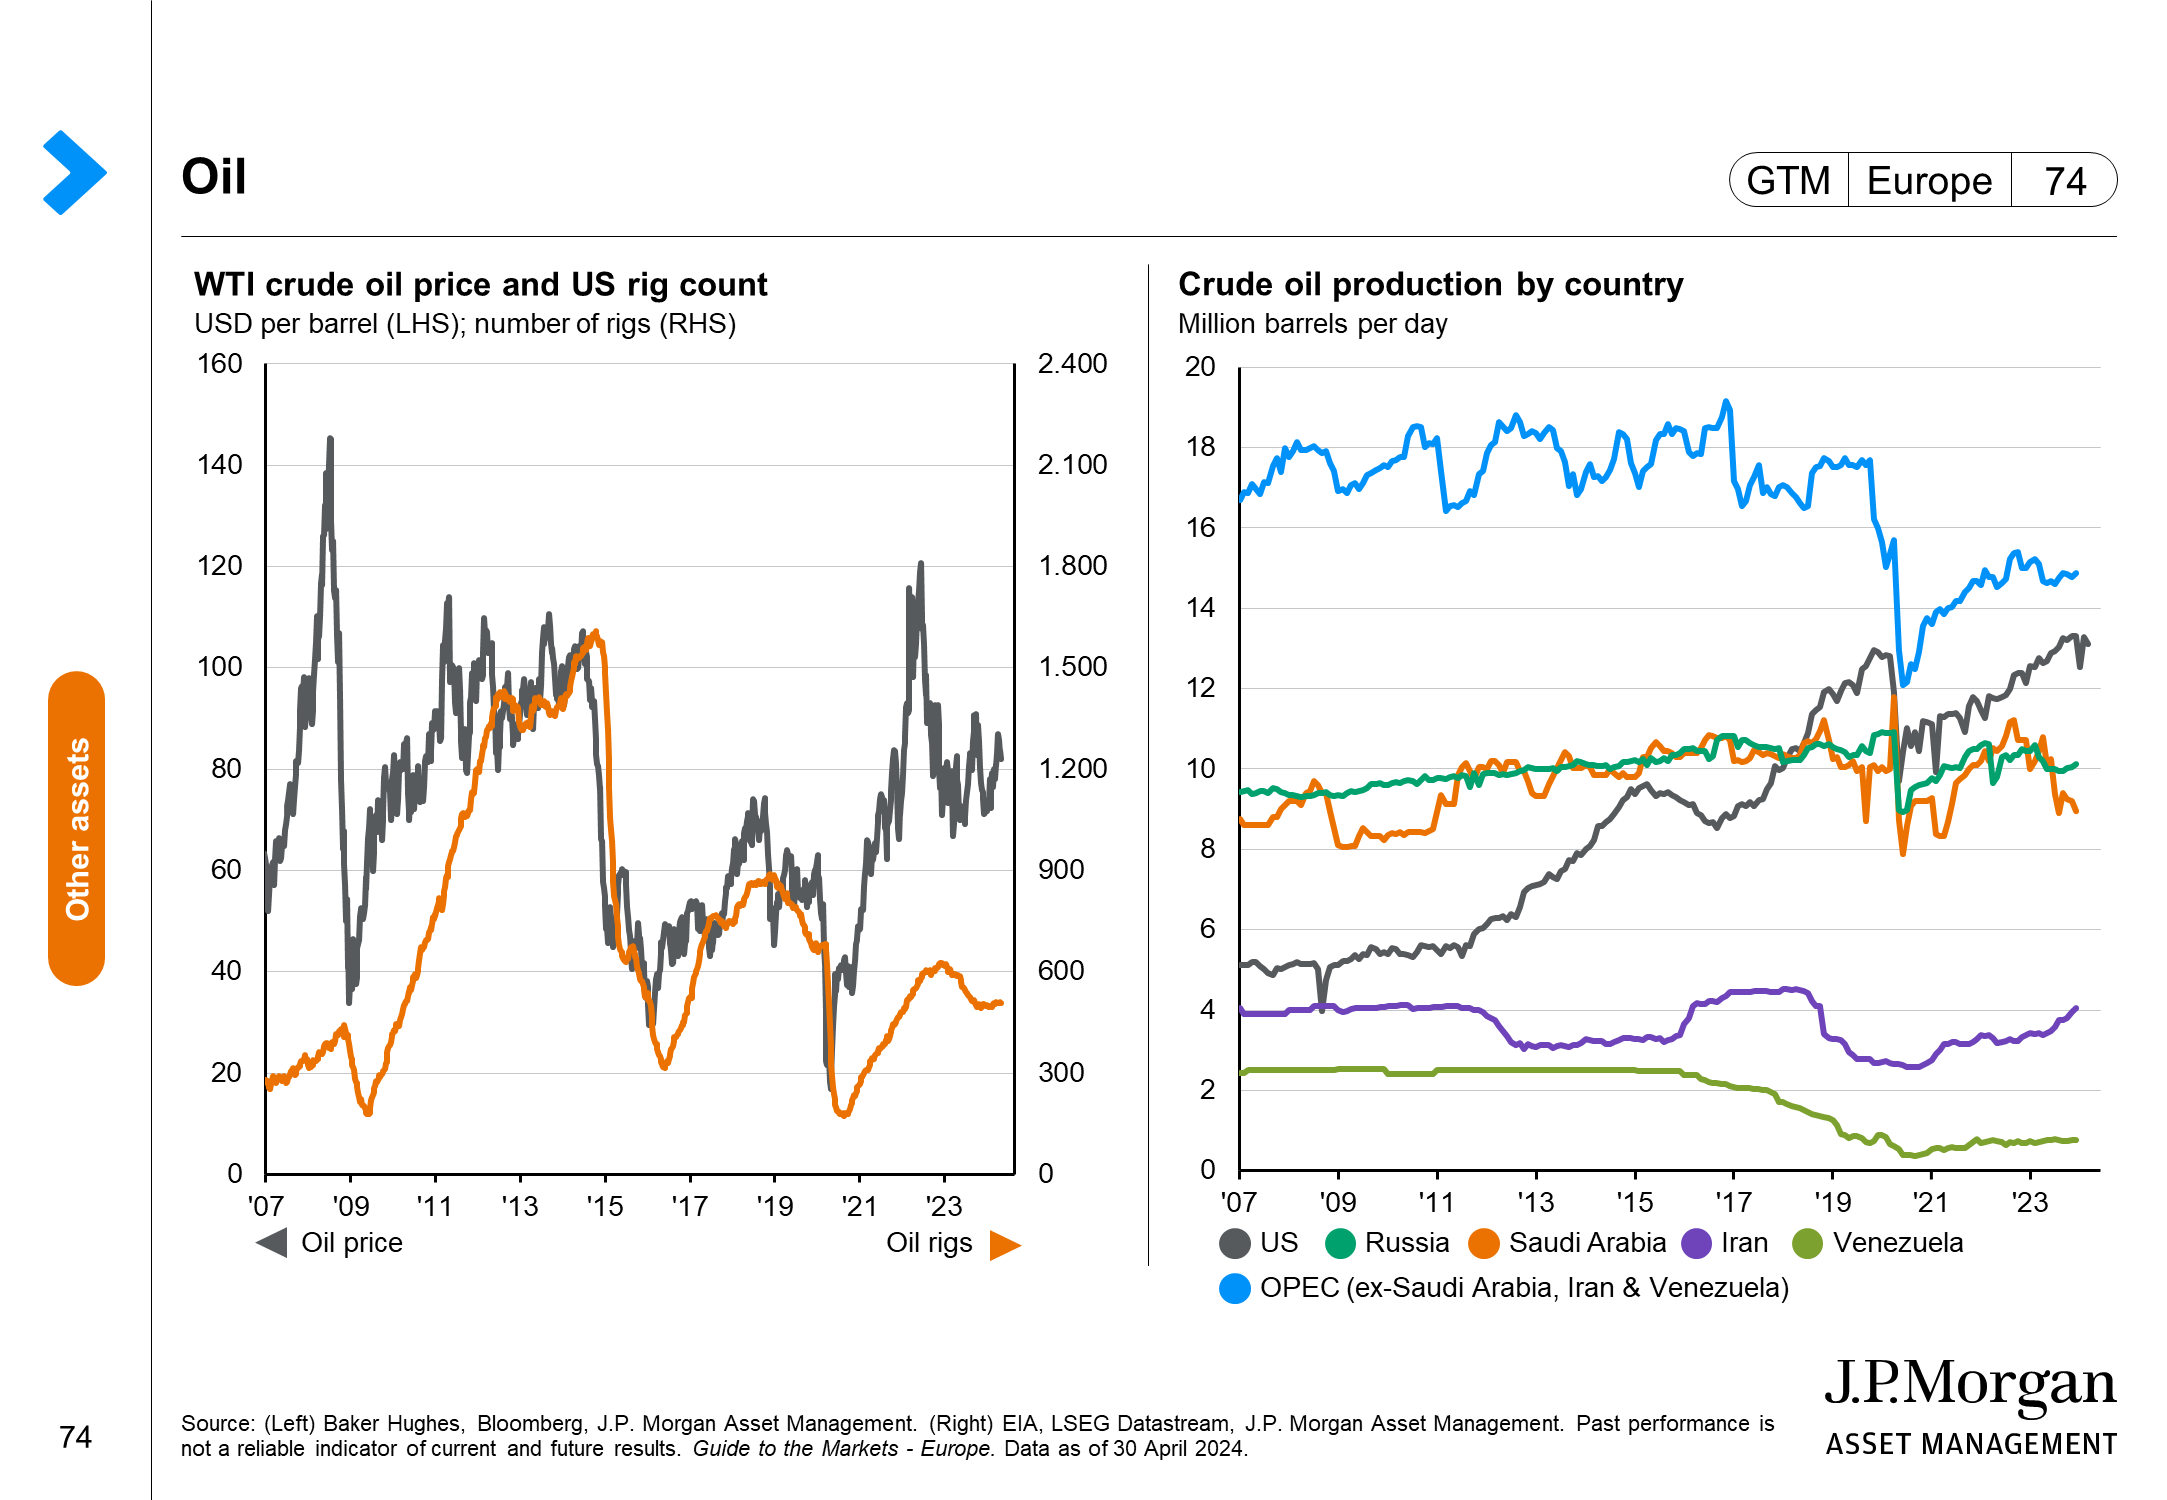
This page assesses the dynamics of the oil market. The left-hand chart looks at the relationship between oil prices and US oil rigs, and shows that the number of oil rigs tend to lag changes in the oil price. The right-hand chart looks at the levels of oil production across key countries.