Projections for stronger portfolios
Our assumptions see attractive real return potential, while differentiation across assets provides a richer hunting ground for active investors .
Topics
Matrices
Our expectations for returns, volatilities and correlations. Use our interactive version to download the excel in your chosen currency.
The assumptions are not designed to inform short term tactical allocation decisions. Our assumptions process is carefully calibrated and constructed to aid investors with strategic asset allocation or policy-level decisions over a 10- to 15-year investment horizon.
Download Excel and PDF matrices by currency
Assumptions
Examine our return projections by major asset class and the thinking behind the numbers.
Long-Term Capital Market Assumptions: Methodology Handbook
A companion volume to dive deeper into our LTCMAs’ building blocks
- Executive Summary
- Macroeconomic
- Public markets
- Private markets
- Volatility, Correlation and Portfolio Implications
EXECUTIVE SUMMARY
Shifting landscapes and silver linings
A steady exposure to stocks and bonds has stood the test of time over the last three decades
Growth of 60/40 over 30 years, and average returns through the period
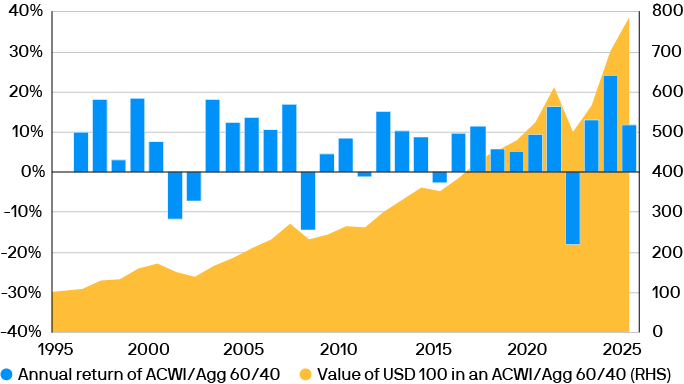
Source: Bloomberg, J.P. Morgan Asset Management; data as of September 30, 2025.
MACROECONOMIC ASSUMPTIONS
Resilient growth and warmer inflation
Tighter immigration policies appear set to pull U.S. labor force growth toward zero
Contributions to U.S. population growth (% change y/y)
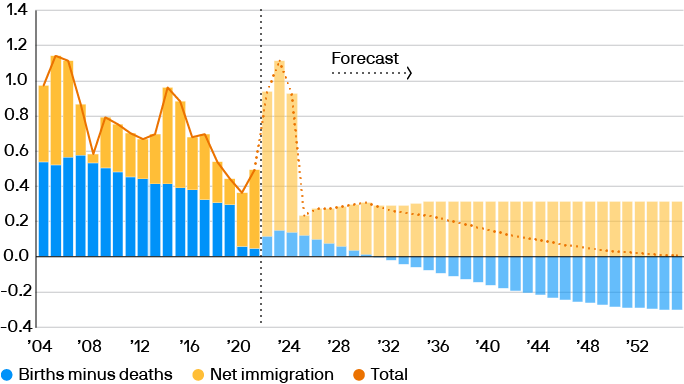
Source: Congressional Budget Office, J.P. Morgan Asset Management; data as of September 30, 2025.
PUBLIC MARKET ASSUMPTIONS
Resilient profits, higher yields
Uncertainty about policymaking stability and safe-haven appeal has raised Treasuries’ term premium
Expected yield curve slope

Source: J.P. Morgan Asset Management; data as of September 30, 2025.
PRIVATE MARKETS AND ALTERNATIVE ASSET ASSUMPTIONS
Powerful market forces set capital in motion
Globally, AI investment continues to drive significant deal flow
Global corporate investment in AI (by type), USD bn
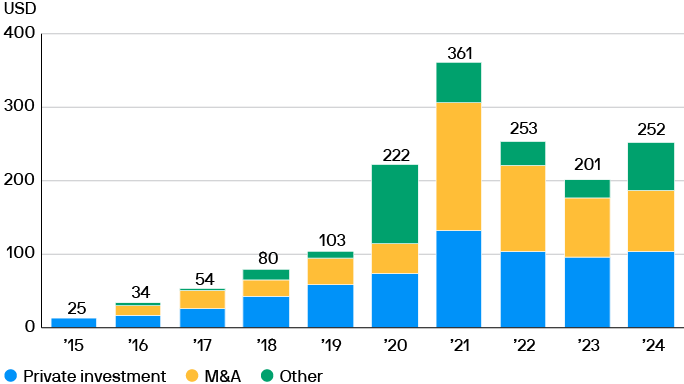
Source: Stanford University Artificial Intelligence Index Report, J.P. Morgan Asset Management; data as of September 30, 2025.
Volatility, Correlation and Portfolio Implications
Changing portfolio construction in a shifting landscape
Portfolios that include alternatives can improve risk-adjusted returns, but the 60/40+ can vary
Projections for portfolio returns and volatility, based on 2026 LTCMA figures
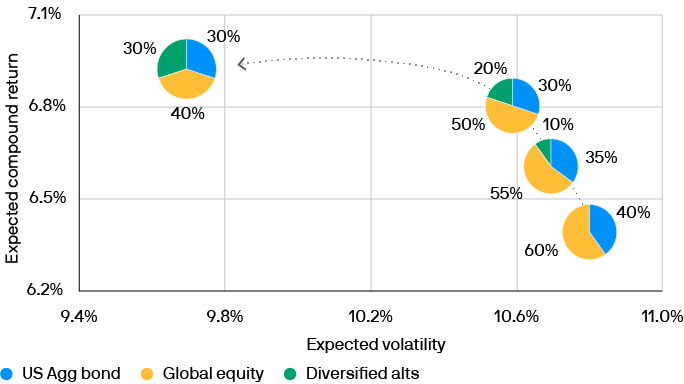
Source: J.P. Morgan Asset Management; data as of September 30, 2025. Diversified alternatives allocation includes global real estate, global real assets, private credit, hedge funds and private equity.
Download this year's Long Term Capital Market Assumptions report