Applying a predictive ratings framework to build solvency capital efficient portfolios
We use forward-looking rating transition matrices to formulate a view on expected solvency-related capital charges in corporate bond portfolios.
08-09-2023
Bhupinder Bahra
Jonathan Msika
In a previous GFICC (Global Fixed Income Currency & Commodities) blog publication we used our proprietary forward-looking rating transition scores and their associated hit rates1 to construct annual rating transition matrices in corporate credit markets. We now apply the resultant 12-month-ahead rating transition probabilities to forecast changes in the solvency capital requirement (SCR) of European investment grade corporate bonds held on behalf of insurance companies.2 Furthermore, we show how these forecasts could be used to help create more efficient portfolios for SCR-sensitive investors.
Calculating expected solvency-related capital charges
Table 1 shows how solvency-related capital charges are stipulated for each bond held in insurance client portfolios.3 The SCR increases with lower rating and higher duration buckets:
Table 1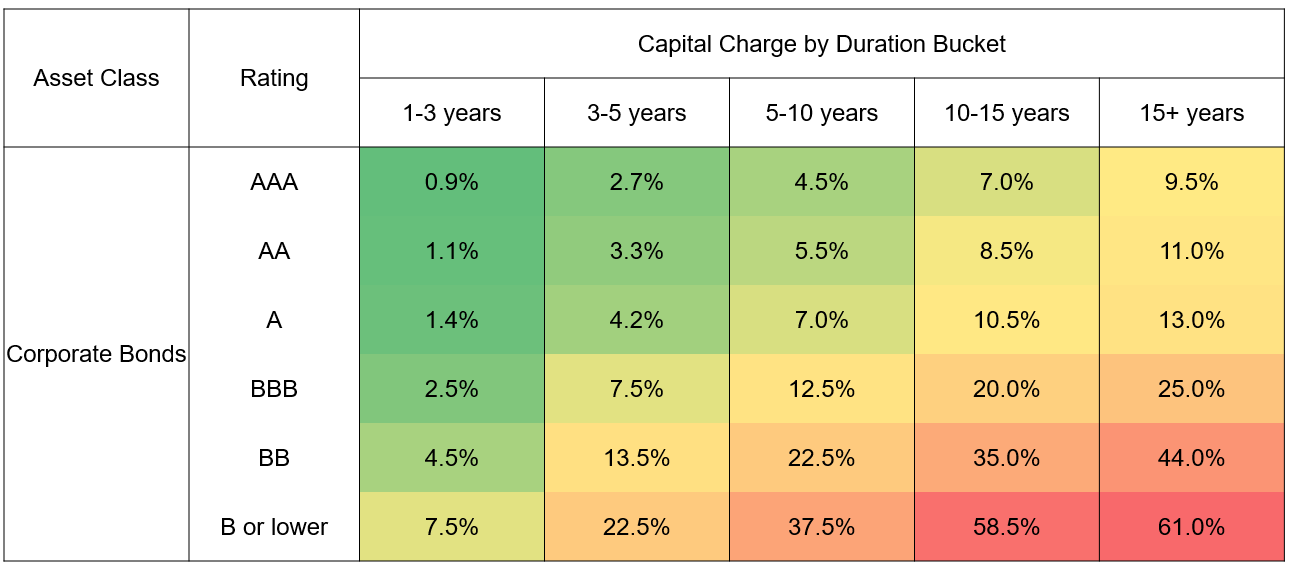
Source: JP Morgan Asset Management. Solvency II standard formula capital charges for market risk. Percentages shown are applied to the market values of risk assets held.
An insurance portfolio manager, who is sensitive to capital charges levied on their bond holdings, should have an interest in knowing how the charges might evolve in the future. Bonds that get upgraded would result in a lower capital charge, as would bonds that rolled down from a high duration bucket to a lower one. The opposite is true of bonds that get downgraded, as their SCR would increase rather exponentially. Note that the capital charges are levied on broad rating buckets. So, within the BBB broad rating category, for example, a BBB- bond would have the same charge levied on it as a BBB or BBB+ bond.
We can use our forward-looking rating transition scores, and their associated event probabilities, to develop a notion of expected capital charge – or expected SCR – for each bond in the portfolio. For example, a given rating transition score has probabilities associated with various potential rating outcomes over the next 12 months. The capital charge for each possible rating outcome is also known. All of this information, for a hypothetical BBB- corporate bond with a rating transition score of “-2 or worse”, and for multi-notch upgrade and downgrade potential rating outcomes, is shown in
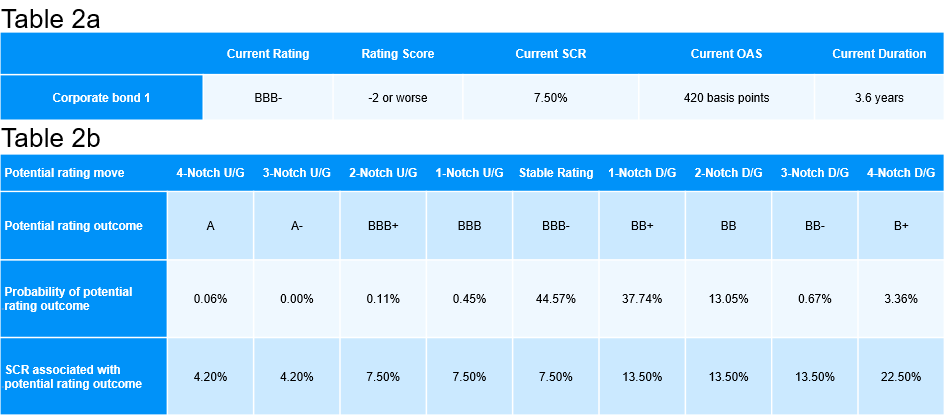
Source: S&P, Moody’s, Fitch, JP Morgan Asset Management. Data as of 31st August 2023. The probabilities shown are the historical hit rates associated with each rating outcome for a bond with a rating score of “-2 or worse”. U/G = upgrade, D/G = downgrade, OAS = option-adjusted spread.
The expected SCR of this bond is calculated as a probability weighted average SCR across the nine potential rating outcomes shown in Table 2b.4 This number comes to 11.09%, which is notably higher than the current capital charge of 7.50%. It is not a surprise that the expected SCR is higher in this example – the bond’s rating transition score is negative, and the probabilities associated with the potential downgrade outcomes are higher than those associated with the potential upgrade outcomes. Furthermore, as described earlier, the regulator’s stipulated SCR’s are exponentially worse at lower rating categories. This can be seen in Figure 1, which provides a visual representation of the SCR data in Table 2b.
Figure 1: SCR associated with potential future rating outcomes for corporate bond 1
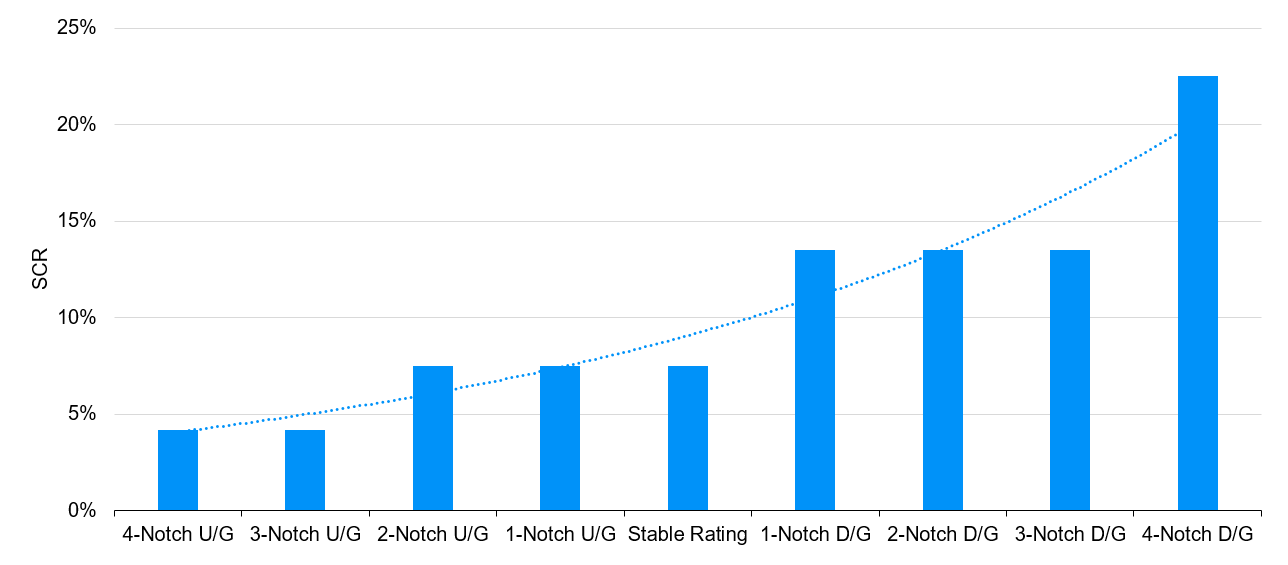
Source: JP Morgan Asset Management. Solvency II standard formula capital charges for market risk, as applied across rating notches for corporate bond 1.
Investment implications
For insurance portfolio managers, it is the expected change in the SCR that matters, both at the individual bond level and at the overall portfolio level. Consider the potential downgrade candidates held in such a mandate. The portfolio manager needs to evaluate the trade-off between the higher spread capture on these bonds and the likely increase in SCR in the future – that is, to assess if the current market spread is sufficient to compensate for the expected jump in the SCR over the next 12 months? In the context of our hypothetical bond, the question the portfolio manager would ask is: is the bond’s option-adjusted spread (OAS) of 420 basis points enough to compensate for the expected jump in SCR from 7.50% to 11.09%?
Figure 2 introduces a way of visualising this concept for every constituent in the European BBB- corporate rating category, as of 31st August 2023.5 Each bond’s OAS (x-axis) is plotted against its expected change in SCR (y-axis). All else being equal, bonds with low spreads and whose capital charges are expected to increase significantly (red box, top left quadrant) are clearly less desirable than bonds with high spreads and whose capital charges are expected to change very little (green box, bottom right quadrant). Even within a given OAS range, for example 400-500 basis points, the bonds lower down on the y-axis are preferable.
Figure 2: European investment grade BBB- universe: expected change in SCR vs. OAS
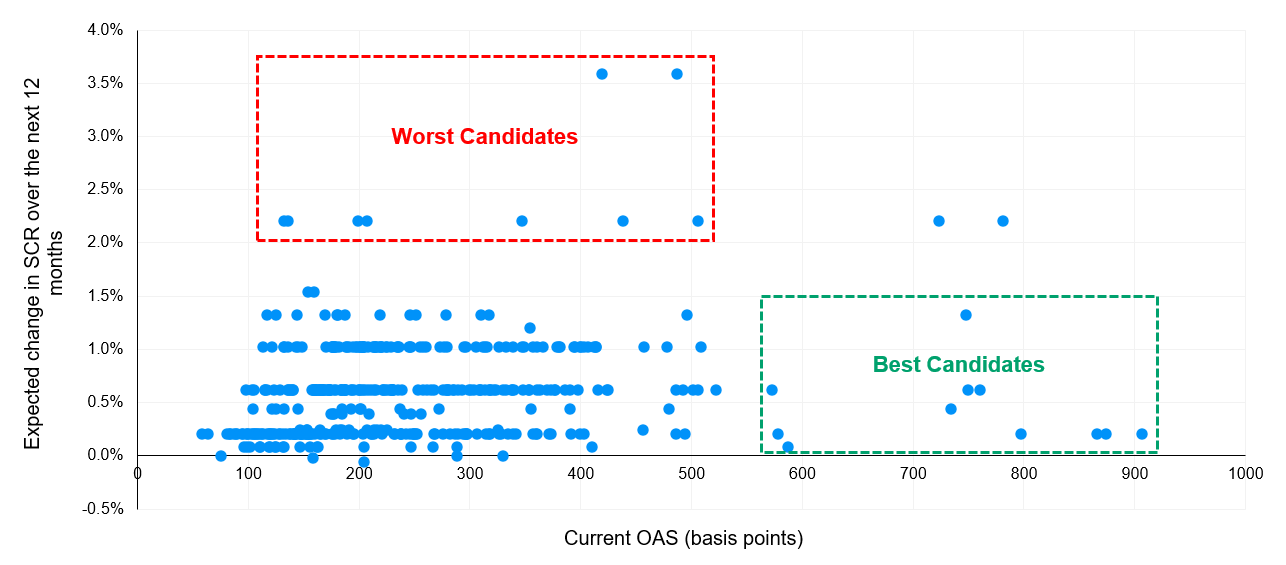
Source: Bloomberg Fixed Income Indices, S&P, Moody’s, Fitch, JP Morgan Asset Management. Data as of 31st August 2023 for constituents of the Bloomberg Euro-Aggregate BBB- Corporates index. Y-axis: expected change in SCR = expected SCR – current SCR.
OAS per unit of SCR is a measure of capital usage that some insurance fund portfolio managers use when making individual buy or sell decisions. Our methodology proposes a more forward-looking assessment by introducing the consideration of OAS relative to expected SCR. This should help improve outcomes for SCR-sensitive investors.
09ng230509133936
1As a reminder, the rating transition scores were made up of three specific indicators derived from rating agency bond-level outputs: (i) rating momentum, (ii) index methodology composite rating bias and (iii) credit watch flag. We define hit rate as an empirical measure of how often, within our historical dataset, composite rating change predictions got materialised over given future time periods.
2The solvency capital requirement (SCR) is the amount of funds that insurance and reinsurance companies are required to hold under the European Union’s Solvency II directive in order to have a 99.5% confidence they could survive the most extreme expected losses over the course of a year. All risk capital held on their behalf needs to account for the regulator’s stipulated capital charges as shown in Table 1.
3In this note, we interchangeably refer to solvency-related capital charges as SCR.
4That is, it’s a simple sum product of the two numerical rows shown in Table 2b.
5This analysis can also be done for a portfolio, though we choose here to demonstrate the concepts on a benchmark.