
Insights on Artificial Intelligence
Artificial intelligence has moved from clever chatbots to an economic force reshaping industries, markets and global competition. This hub explores the AI story in depth, from the infrastructure supercycle to the winners and risks across the value chain.
-
The AI Ecosystem
-
The Agentic Boom
-
The AI Capex Boom
-
Energy and AI Infrastructure
-
State of Business Adoption
-
Productivity Potential
-
The Private Market Landscape
The AI Ecosystem
To have any conversation about the AI investment boom, we must first understand the increasingly sprawling AI ecosystem.
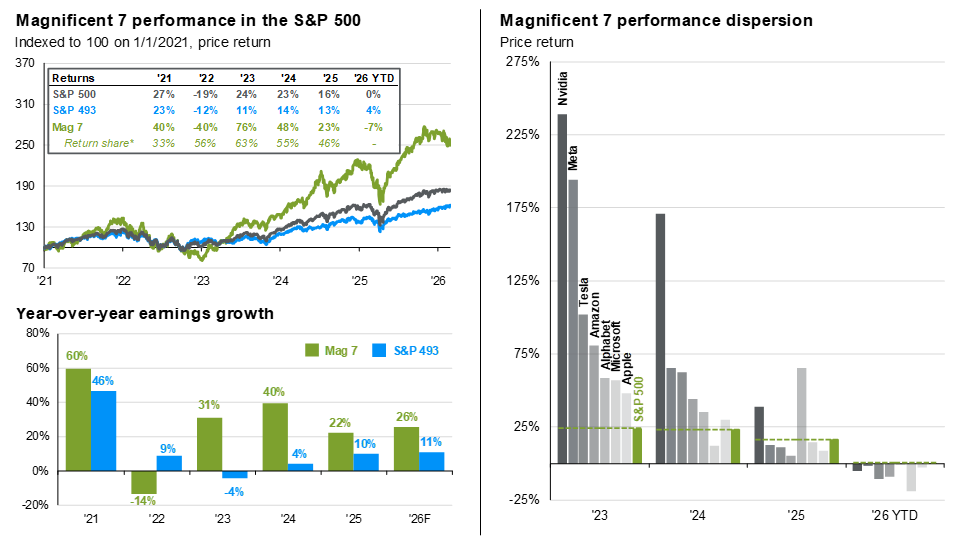
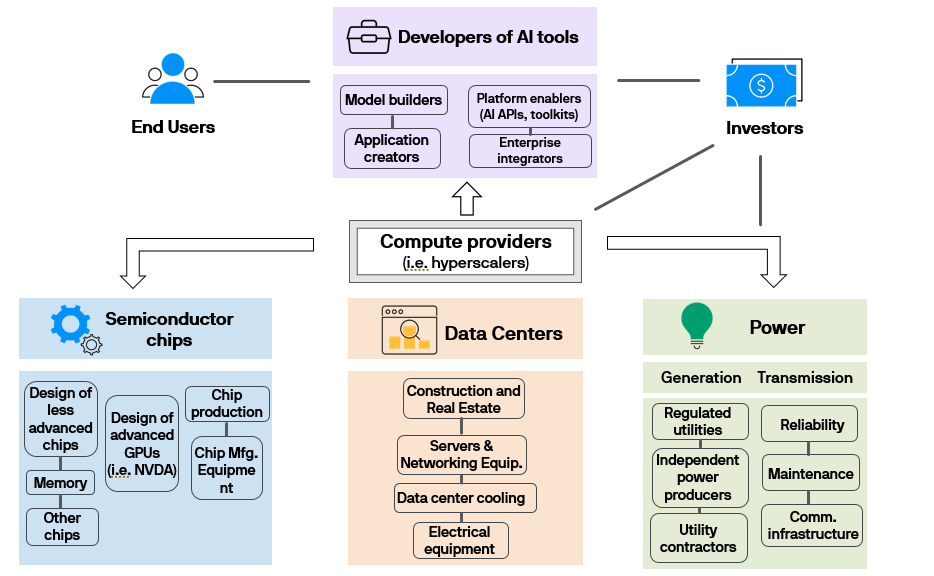
The hardware manufacturers sit at the bottom of the tech stack. This group includes companies like Nvidia (which designs highly sophisticated chips), TSMC (which manufactures chips for Nvidia and others) and ASML (which creates the incredibly precise tools used in chip manufacturing). While Nvidia has long been the market leader for the most sophisticated chips integral to AI, competitors like AMD and Broadcom are gaining ground. Data centers and power round out core AI infrastructure, with companies specializing in construction, cooling, electrical equipment and power generation.
Next come the “hyperscalers.” This group includes industry titans such as Alphabet, Amazon’s AWS business, Meta, Microsoft’s Azure and Oracle.1 These firms build and operate data centers that are the backbone to AI and cloud computing. With roughly half of AI-related capex going towards chips, the hyperscalers are critical customers for the hardware makers and increasingly drive demand for power generation and transmission.
The third group is the AI architects. These companies develop large language models (LLMs) and other applications used for everything from video creation to chatbots to medical research. Since ChatGPT’s launch, competition has intensified with Anthropic’s Claude, Google’s Gemini and xAI’s Grok emerging as leading alternatives, alongside open-source models like China’s DeepSeek. No single model dominates across domains, and while raw performance is important, differentiation also hinges on ecosystems, enterprise integration and trust. Because LLMs require immense compute for both training and deployment, AI architects are major customers of the hyperscalers’ infrastructure.
If these three groups supply AI infrastructure, who generates the demand? Users range from individuals (using ChatGPT on a mobile device), to enterprises (like a call center that deploys AI chatbots), to developers building AI agents.
In a well-functioning, mature ecosystem, the money spent by the end users should generate profits across the value chain. Like your weekly supermarket shop, the money you spend at check-out should be enough for the supermarket, the real estate operator, the electricity provider, the food manufacturers and the farmers to all take their cut.
Today, end-user demand, at both an individual and enterprise level, is not yet sufficient for all players to turn a profit. Hyperscalers have been largely footing the bill, using revenues from other businesses to fund AI capacity investments, which in turn supports hardware makers. Monetization has continued to build, with growth in paid LLM users (ChatGPT now has over 900M weekly active users and 50M paying subscribers2), accelerating enterprise adoption and expanding cloud services demand. Whether demand grows quickly enough to deliver a reasonable return on investment across the value chain is ultimately the million/billion/trillion-dollar question.
The AI Ecosystem

1 While Microsoft is a significant investor in OpenAI, the company’s primary AI revenue is generated through its Azure cloud computing platform rather than direct LLM sales.
2 OpenAI, February 2026.
The Agentic Boom
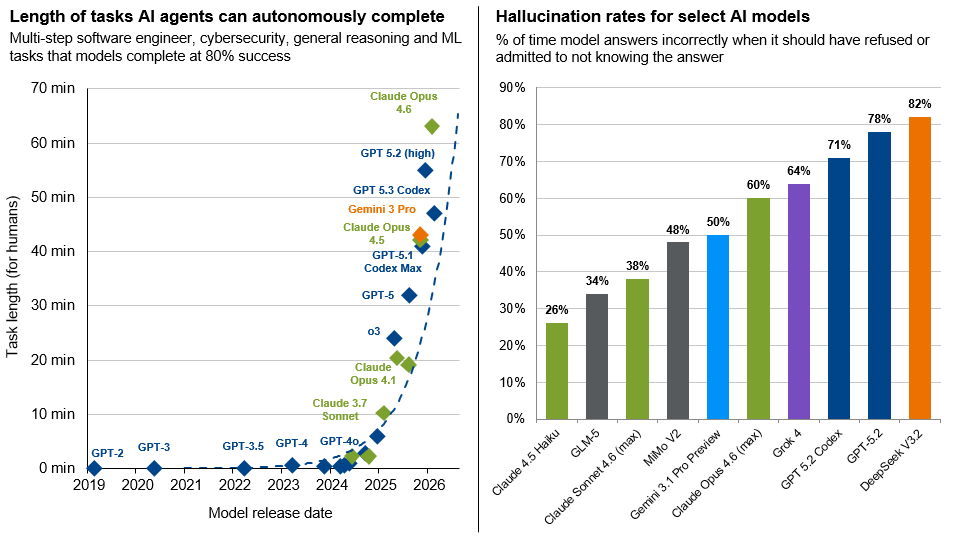
Until recently, most AI interactions followed a simple pattern where you ask a question, and you get an answer. Today, AI systems can reason through multi-step problems, call external tools, write and execute code, and persist across sessions. This shift from single-turn question-and-answer to autonomous, agentic workflows is changing the compute math, the competitive landscape and the infrastructure buildout.
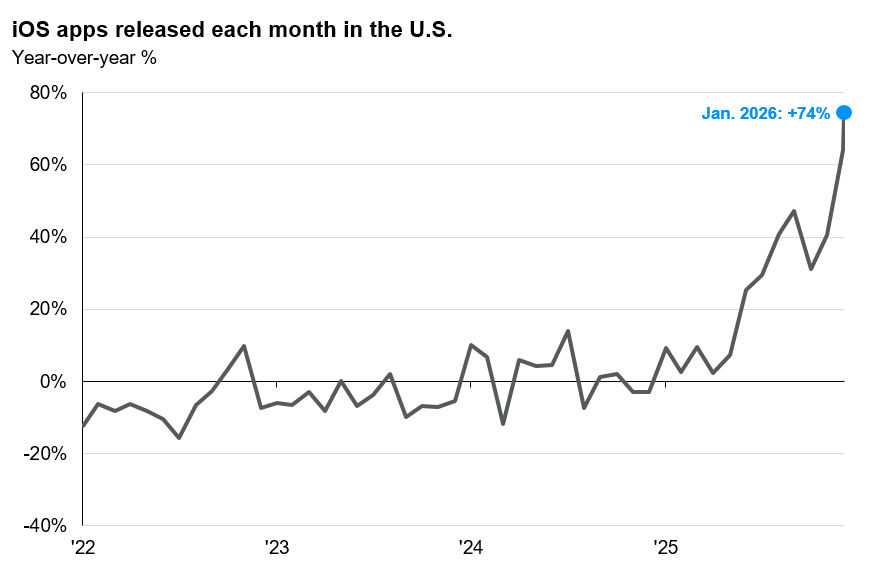
2025 marked an inflection point in the way people use AI. Reasoning models, which perform extended deliberation before responding, went from negligible to over 50% of AI usage.3 Average prompt lengths quadrupled and output lengths nearly tripled, suggesting richer, more detailed responses. And with the rising popularity of “vibe coding,” programming with AI surged from 11% to over 50% of total token volume.
Agentic AI is compounding the need for compute. If a single automated task can trigger dozens of inference calls, compute requirements compound fast. Whereas training is a one-time cost, inference runs every time someone uses a model, and inference has now overtaken training as the dominant compute workload. More users, doing more complex tasks, each consuming more compute is driving AI infrastructure needs higher.
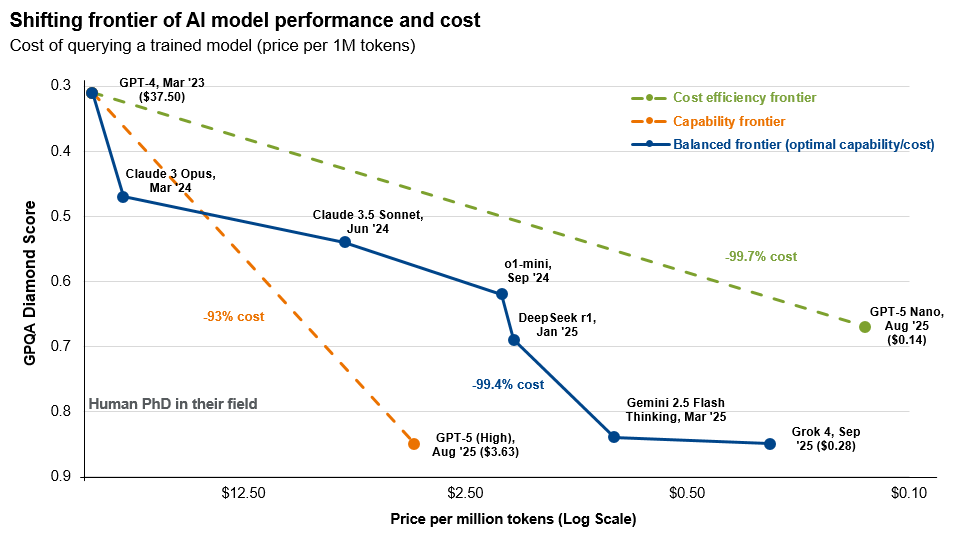
At the same time, costs are falling fast. The price of equivalent AI performance has dropped roughly 1,000x in three years, faster than Moore’s Law.4 Competition between proprietary and open-source models is helping lower prices across the board, but falling unit costs have not meant falling total spend. Lower prices have helped drive wider adoption (known as “Jevons Paradox”), resulting in heavier usage and more complex workloads, keeping compute demand rising even as individual queries get cheaper.
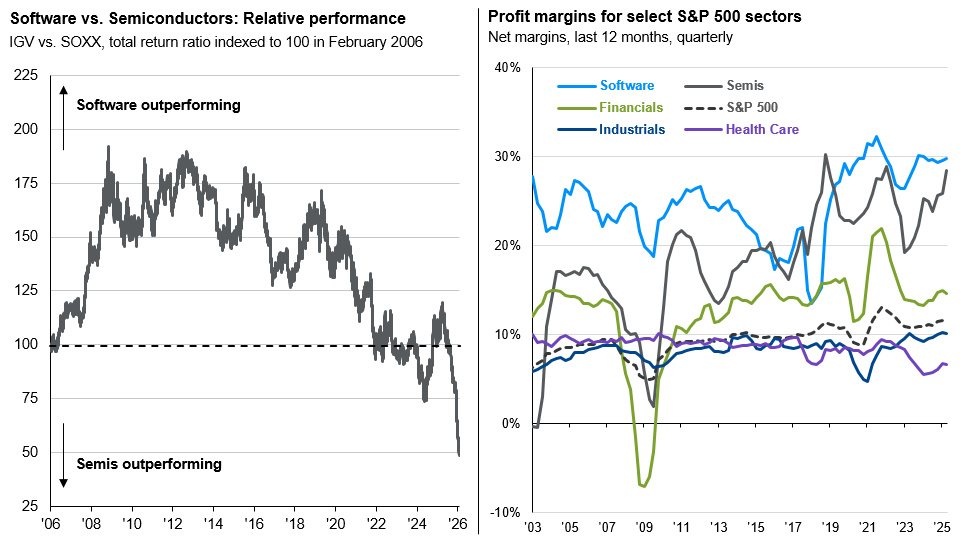
For investors, the agentic shift also raises the stakes on disruption. Companies that have traditionally relied on sticky contracts, recurring subscriptions and high switching costs, but stand in the path of AI automation, face rising uncertainty around future earnings. Software stocks were the first fault line to crack, facing their worst quarter in Q1 since the Global Financial Crisis, as new coding automation tools raised questions about competitive dynamics and business model resiliency. But the pressure extends well beyond software, to potentially any business built on labor-intensive, codifiable work.
Over time, though, this uncertainty should gradually resolve as investors gain visibility into which companies are capitalizing on AI and which are ceding ground. The tools themselves are clearly productivity-enhancing, but where value accrues, and how those gains get distributed, remains the central question markets are struggling to price.
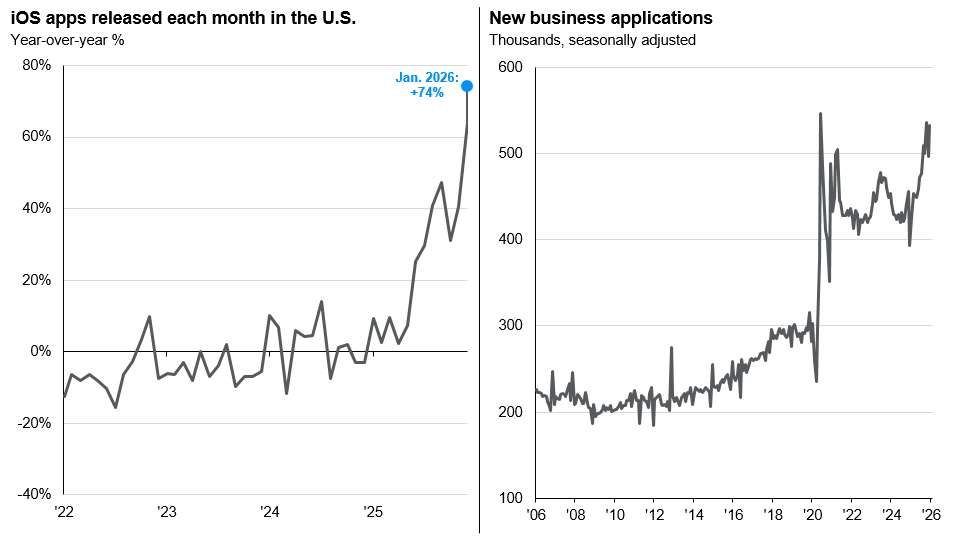
”Vibe coding” is accelerating product development and innovation
3 OpenRouter, “State of AI,” December 2025.
4 a16z Infrastructure, “LLMflation,” 2024.
The AI Capex Boom
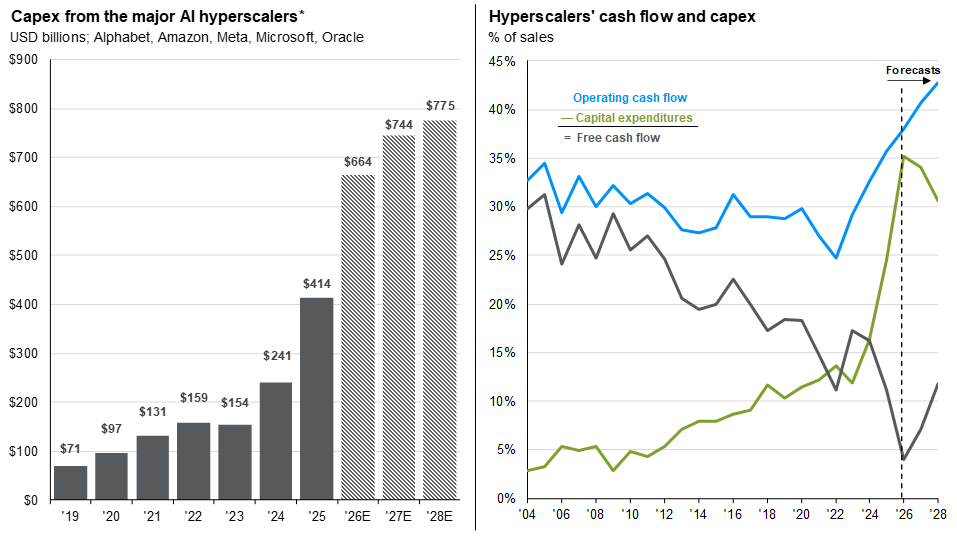
Hyperscaler capex surpassed $400 billion in 2025 and is on track to approach $700 billion in 2026, up fivefold from five years prior. AI spending is already significant in historical terms, rivaling peak capital intensity during the late-1990s telecom boom.5 Against this backdrop, investors are asking: how much compute do we really need, and is this boom sustainable?
Demand still outpacing supply.
The rapid clip of spending has been grounded in surging compute demand, a key difference from the late-1990s internet buildout. In 2002, only 7% of the fiber optic network was being used, and it took years for excess capacity to be absorbed. Today, data center vacancy rates sit at 1.6%, among the tightest on record, with over 70% of capacity under construction already pre-leased.6 Each of the major hyperscalers cited "Jevons Paradox" in their most recent earnings calls, pointing to demand backlogs that cannot be fulfilled due to capacity constraints. Cloud service revenue was up 37% year-over-year in 4Q25, and with adoption expected to grow and deepen, AI leaders are racing to secure compute capacity for the years ahead.
Robust balance sheets, but fraying at the edges.
A unique feature of this buildout has been its cash-financed nature. The major hyperscalers collectively hold over $400 billion in liquid cash and are expected to generate more than $600 billion in operating cash flow in 2026. Average net debt-to-EBITDA sits at 0.8x, well below the 2.6x average for investment-grade issuers. But the pace of spending is straining even the strongest balance sheets. Several hyperscalers are projecting sharp declines in free cash flow and ramping up debt issuance, with bond issuance expected to reach $285 billion this year, up from roughly $120 billion in 2025.7 These remain among the most profitable companies in history, but the purely self-funded era is evolving, and variance in balance sheet strength across companies is widening.
Existential spending.
History warns of the pitfalls of rapid capex booms, including overbuilding and misallocation. But consider the pressures driving the spend:
- Companies with search monopolies fear users migrating to AI chatbots and agents instead of traditional search.
- Cloud leaders must expand infrastructure to keep up with demand or risk losing market share.
- Smartphone makers question the relevance of their devices in an AI-first world.
These firms are reinvesting profits from dominant legacy businesses to secure future leadership, yet returns remain uncertain. Business models tied to AI infrastructure are still evolving, as is pricing power for AI services. But as long as supply constraints persist and competitive pressures remain acute, the hurdle for continued investment remains low.
A massive spending boom is underway, funded largely by hyperscaler cash flows

Source: Bloomberg, J.P. Morgan Asset Management. Data for 2026, 2027 and 2028 reflect consensus estimates. Capex shown is company total. *Hyperscalers are the large cloud computing companies that own and operate data centers with horizontally linked servers that, along with cooling and data storage capabilities, enable them to house and operate AI workloads. Guide to the Markets – U.S. Data are as of February 27, 2026.
5 Goldman Sachs, “Why AI Companies May Invest More than $500 Billion in 2026”, December 2025.
6 CBRE, North America Data Center Trends H1 2025.
7 Reuters and CNBC.
Energy and AI Infrastructure
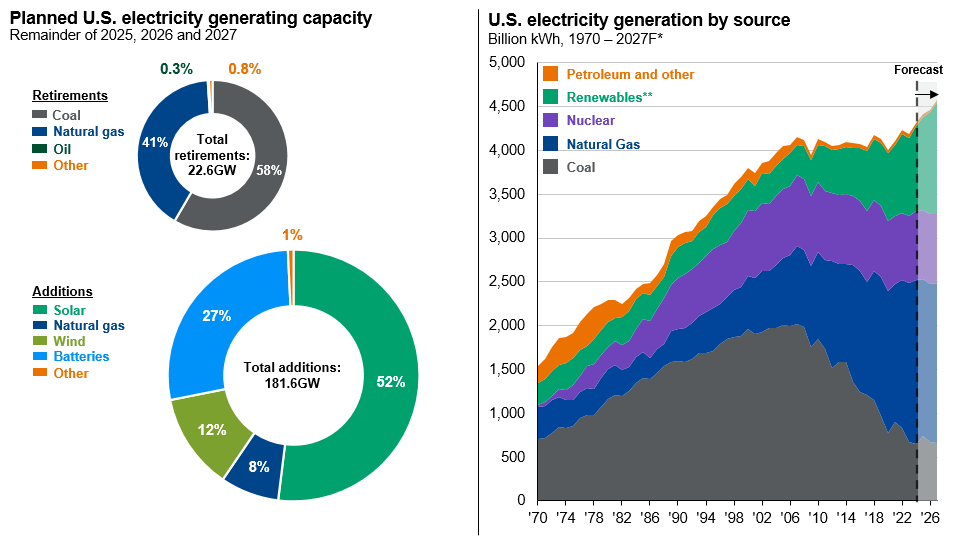
Power is emerging as the binding constraint of the AI buildout. After 25 years of essentially flat U.S. electricity demand, data centers have triggered load growth not seen since the 1950s, and the gap between when infrastructure can be built and when the energy to run it becomes available is creating both risks and investment opportunities.
Demand is surging at every level of the stack. Data centers account for roughly 5% of U.S. electricity consumption, expected to climb to 12% by 2030.8 And generation of hardware raises the bar further. A traditional server rack consumed 5 to 20 kilowatts of power, while Nvidia’s Blackwell chip pushes a single rack to over 120 kilowatts, a 6x increase, with the hardware refreshing every four to six years. Some newer facilities are only utilizing 20% of their physical footprint because they cannot get enough electricity to power the rest.
Supply cannot keep pace. A new data center can be built in 2-3 years, but new power generation typically takes 5-10 years and grid transmission can take even longer to permit and construct. Meanwhile, much of the equipment managing the U.S. grid is decades old and approaching end of life. Infrastructure largely designed in the 19th century and built out in the mid-20th, now absorbing 21st-century loads. Closing the gap will require an estimated $720 billion in grid investment through 2030.9
This mismatch has reignited interest in nuclear energy, with multiple hyperscalers signing long-term agreements for gigawatt-scale nuclear capacity. But nuclear moves slowly: only two new reactors have come online in the U.S. in the last decade, and new projects face permitting timelines of up to 15 years. Natural gas is filling the gap in the meantime, and the reversal has been dramatic. In 2022, the entire U.S. market for large gas turbines was limit to a single order. Today, every major manufacturer is sold out through 2030.10 AI has effectively given natural gas a second life.
Power consumption does not end at the server, either. An estimated 40% of traditional data center energy goes to cooling,11 and AI chips generate far more heat than traditional processors. The share of AI training servers using liquid cooling is projected to rise from 15% in 2024 to 74% in 2026,12 driving demand for entirely new cooling infrastructure.
The scale of what's required across generation, transmission, and cooling adds up to one of the largest capital deployment cycles in decades. Power assets typically feature contracted revenues, regulated returns and real asset backing, and with much of the grid approaching end of life, the modernization cycle looks structural rather than cyclical. For investors tracking the AI buildout, the energy constraint may prove a more durable theme than technological race itself, and offers a different risk profile for those looking for diversify their AI exposure.
After 20+ years of stagnation, the U.S. is finally upgrading its electric grid.
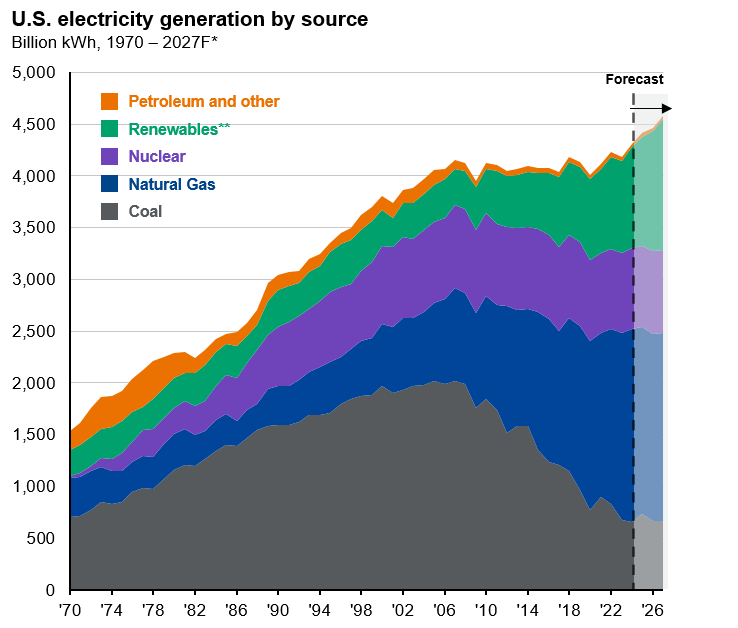
Source: EIA, J.P. Morgan Asset Management. Data is from the EIA’s “January 2026 Monthly Energy Review” report. *Energy forecast figures are from EIA's "Short Term Energy Outlook.“ **Renewables include wind, solar, geothermal, biomass waste, biomass wood and hydroelectric. Guide to Alternatives. Data are based on availability as of February 28, 2026.
8 DOE/Berkeley Lab, 2025; McKinsey & Company.
9 Goldman Sachs, “AI to Drive 165% Increase in Data Center Power Demand by 2030,” February 2025.
10 Bloomberg, “AI-Driven Demand for Gas Turbines Risks a New Energy Crunch.” October 2025.
11 Guide to Alternatives, page 40. Ahmed, Bollen and Alvarez, “A Review of Data Centers Energy Consumption and Reliability Modeling” (2021).
12 Goldman Sachs, “Chilling Opportunity,” October 2025.
State of Business Adoption
While advancements at the AI frontier appear exponential, business adoption has been more linear, jagged, and ridden with potholes from organizational bottlenecks, human behavior and unit economics.
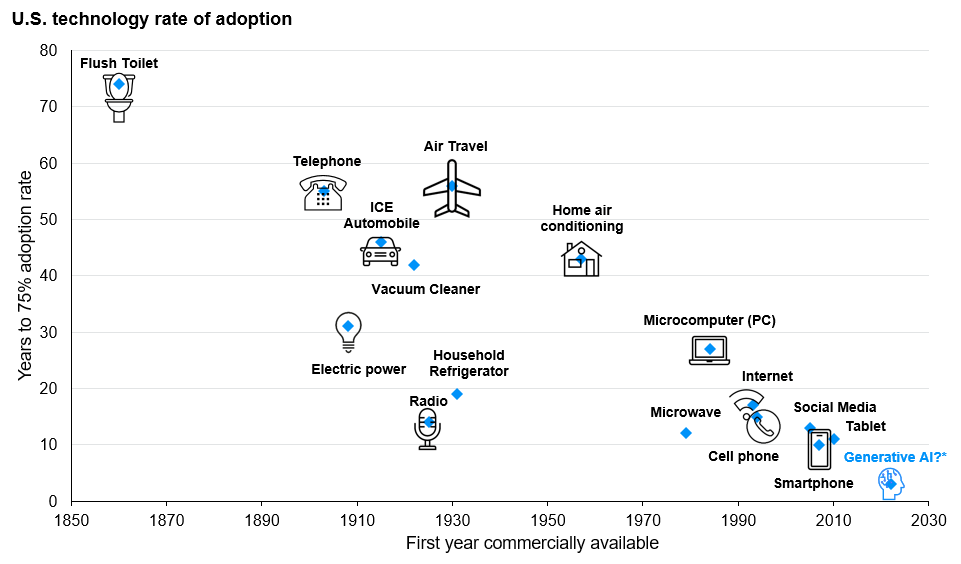
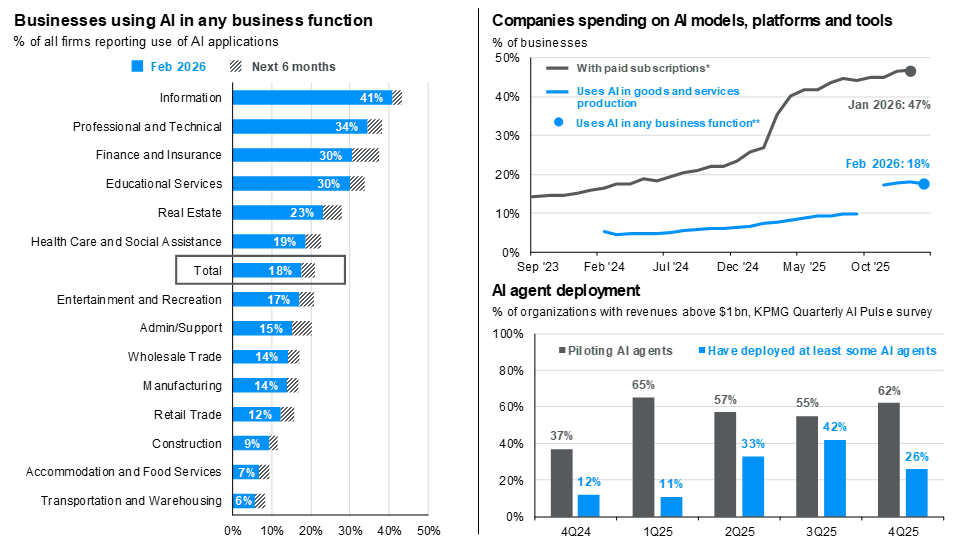
By some measures, AI adoption has outpaced anything we have seen before. About 55% of Americans are already using generative AI at least once a week,13 an adoption rate that took the internet 16 years to achieve. The Census Bureau reports that 18% of U.S. firms have formally adopted AI in some business function, and 44% pay for some form of AI subscription. Where formal adoption lags, workers are splitting the difference on their own, with nearly half of those who use AI on the job doing so through personal accounts.14
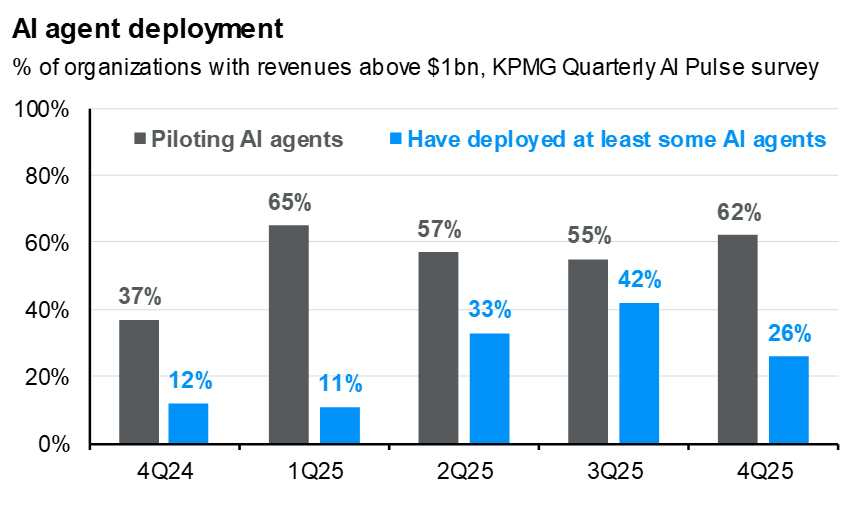
Breadth matters less than the intensity of adoption, and the gap between the two is increasingly wide. For instance, giving a customer service team access to a chatbot is a quite different proposition than deploying an AI agent that triages, routes and resolves tickets across the entire operation without human intervention. This is partly behind the growing focus on agentic AI, with agent deployment more than doubling from 11% to 26% of organizations over the course of 2025.15
Businesses move from pilot to deployment of AI agents
The real productivity gains are less likely to come from automating any single task, but from rethinking workflows, business models and redistributing labor. McKinsey finds that while nearly 90% of companies have invested in AI technology, fewer than 40% report measurable gains, largely because most are applying AI to discrete tasks rather than redesigning how work gets done.16
Some characteristics of early adoption:
- Digital-native sectors are leading: Tech, finance and professional services lead in formal adoption, with the benefit of leveraging existing digital infrastructure.
- The size gap is narrowing: The latest data shows show large firms report AI usage at 10.5% compared to 8.8% for small firms, a narrower gap from a year prior as tools become more accessible and affordable. Studies have also shown that small teams are uniquely well-positioned to harness AI.
- Companies are using AI as a competitive lever: In recent earnings calls, a majority of S&P 500 companies that mentioned AI specifically cited automation, optimization or efficiency use cases, particularly to manage costs amid policy uncertainty.
Then there are the potholes. Security, regulatory compliance and legacy system integration remain immediate barriers, particularly in manufacturing, healthcare and government. Even where access is easier, the broader rethinking of workflows and business models demands organizational change that most companies have not yet begun. And unit economics present a less discussed friction: the most capable AI agents require significant inference compute per task, and those costs can limit how deep enterprise deployment actually gets.
For investors, what matters now is the transition from tech adoption to tech deployment. As AI moves from an IT line item to a performance lever across sectors, how companies use that lever may ultimately define who leads and who lags.
AI adoption is growing fastest in digitally native sectors, and informal adoption outpaces formal adoption.
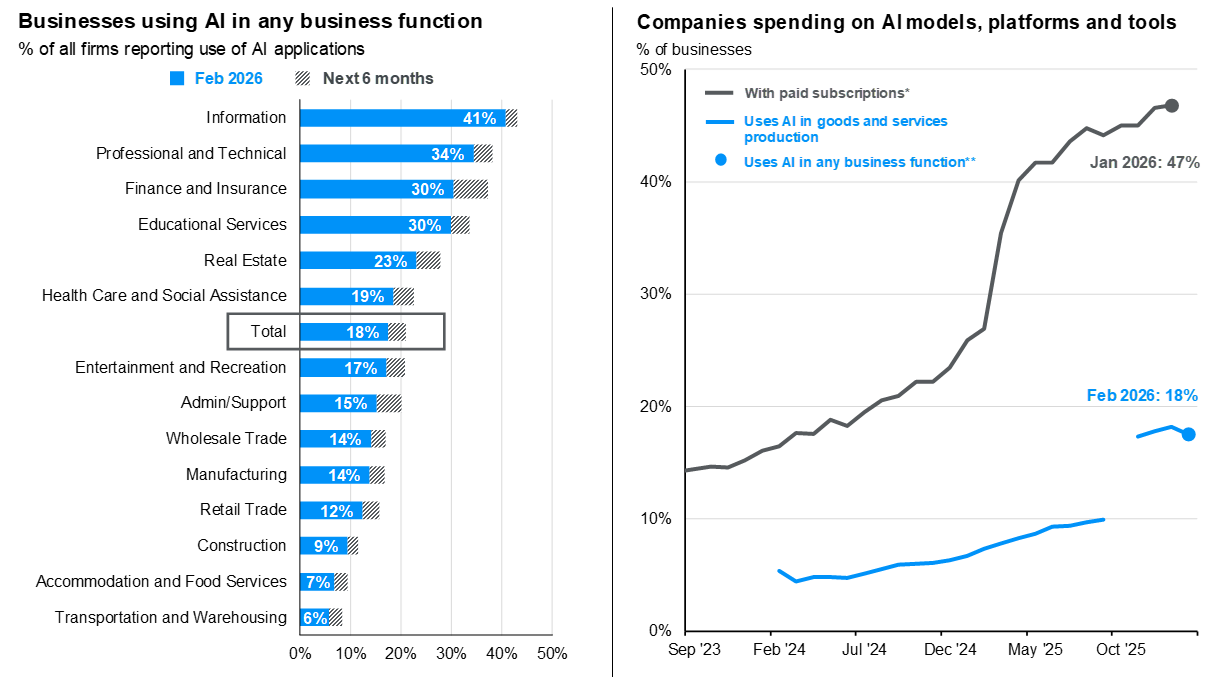
Source: J.P. Morgan Asset Management; (Left) Census Business Trends and Outlook Survey; (Right) RAMP AI Index; *Ramp data is based on anonymized corporate card and bill-pay transactions with AI vendors across over 50,000 U.S. businesses on Ramp’s spend platform to provide a spend-based measure of AI adoption that complements the self-reported AI use (which includes free and internal tools) in the Census survey series. The two measures differ in firm coverage and methodology, with Ramp data skewed towards digitally enabled firms.**Starting Dec. 2025, the Census changed the wording of their survey question to capture usage of AI in “any business function”, broader language compared to their prior “in producing goods and services” question. Total adoption jumped from 10% to 17% of businesses because of this switch.
Guide to the Markets – U.S. Data are as of February 28, 2026.
13 Harvard Project on Workforce, Generative AI Adoption Tracker.
14 Kim et. al, “AI and the Labor Market: A Worker’s-Eye View,” February 2026.
15 KPMG, AI Quarterly Pulse Survey, 2025.
16 McKinsey Global Institute, “Agents, Robots and Us,” 2025.
Productivity Potential
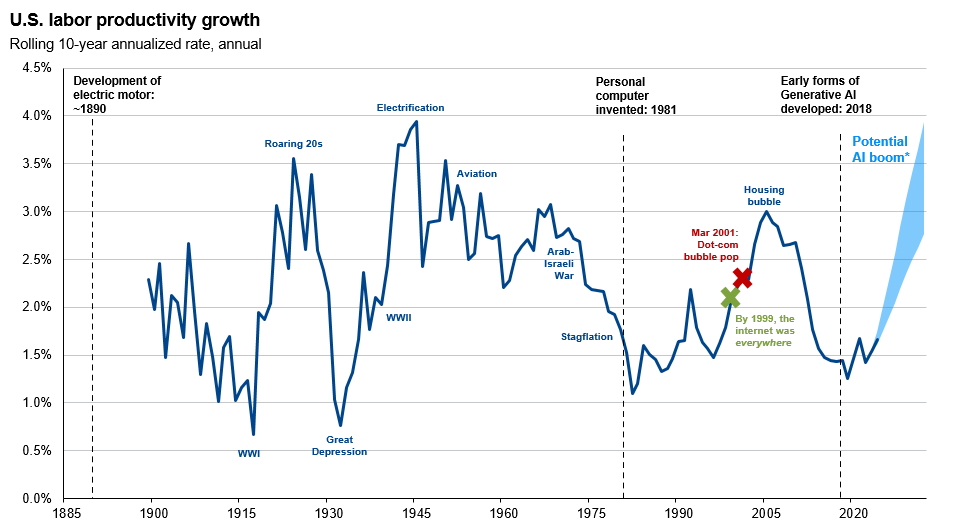
Paul Krugman once noted, “Productivity isn’t everything, but in the long run it is almost everything.” By increasing productivity, the U.S. can improve its standard of living, reduce debt, create jobs in new industries and lower costs. With AI poised to become the next “general purpose technology,” the evidence is beginning to suggest we may be on the cusp of a new productivity boom.
In our 2023 whitepaper “The transformative power of generative AI,” we explored adoption scenarios that could accelerate productivity growth to between 1.0 and 4.0% annually over the next decade. Such a boost would be significant, though not without historical precedent.
Signs of an upswing are becoming harder to dismiss. U.S. nonfarm labor productivity grew at 2.7% in 2024, nearly double the decade average of 1.4%, with the third quarter of 2025 producing a particularly strong reading of 4.9% annualized growth. Past technological advancements rarely delivered lasting productivity gains, yet the economy is producing more output per hour worked than historical patterns would have predicted.
Research from the St. Louis Fed suggests AI may have already added over 1% to labor productivity cumulatively since the launch of ChatGPT in late 2022. Firm-level evidence is mounting as well. eight-month Harvard Business Review study tracking knowledge workers using AI tools daily found that they completed tasks faster, expanded into responsibilities they had not previously handled and made fuller use of their workdays. It is still far too early to conclude AI’s impact on labor and productivity, but accumulating evidence points to meaningful transformation ahead.
This has important implications for investor return assumptions. In our 2026 Long-Term Capital Market Assumptions, we’ve incorporated a modest positive increment to total factor productivity (TFP) growth over the 10-to-15 year horizon, with the U.S. assumption at 1.0% still conservative, but already enhancing our expectations for economic growth and corporate earnings potential. If adoption broadens beyond technology and professional services, TFP could plausibly reach 1.2–1.5%, compared to the 0.3-0.6% average from 2005 to 2020.
Long term, AI presents meaningful productivity upside
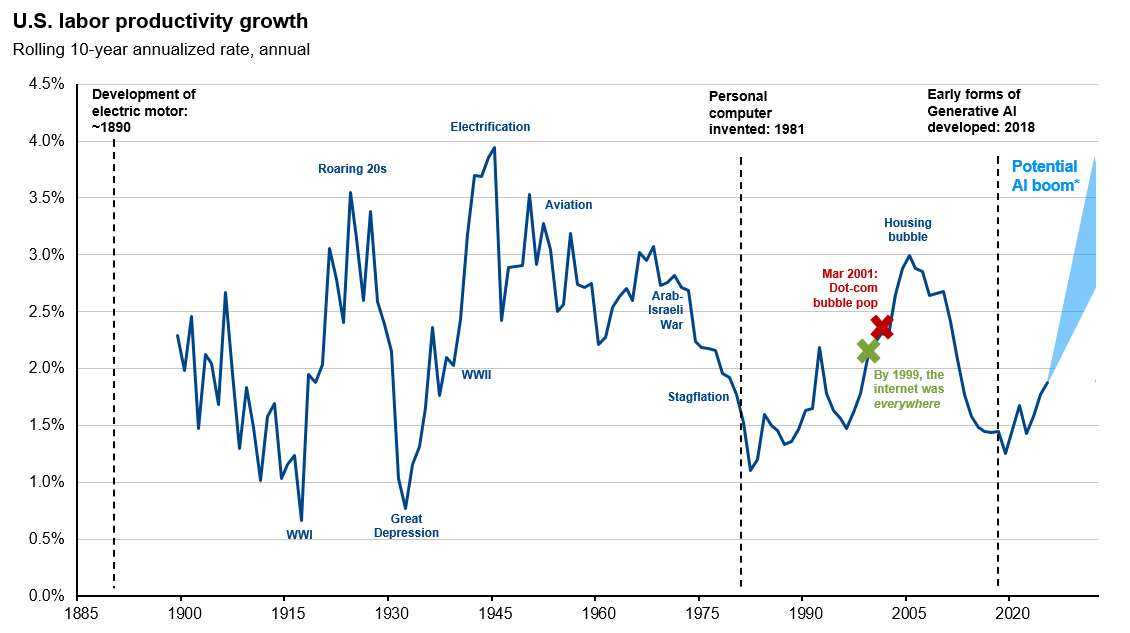
*J.P. Morgan Asset Management estimates plausible productivity gains of 1.4-2.7% from generative AI and other AI technologies over the next few years, in addition to the expected 1.5% annual productivity growth projected by the Congressional Budget Office.
Source: BLS, NBER, J.P. Morgan Asset Management. Data from 1888 to 1957 reflect productivity data for the total private economy from John Kendrick, “Productivity Trends in the United States,” NBER. Data from 1958 to 2023 reflect non-farm productivity data from the BLS. Forecasts, projections and other forward-looking statements are based upon current beliefs and expectations. They are for illustrative purposes only and serve as an indication of what may occur. Given the inherent uncertainties and risks associated with forecasts, projections or other forward-looking statements, actual events, results or performance may differ materially from those reflected or contemplated. Data are as of March 6, 2026.
The Private Market Landscape
Unlike the dot-com era, which saw an explosion of young companies going public “pre-revenue,” today’s AI race is characterized by disruptive firms achieving public company scale and valuation while staying private. That shift is reshaping how and where value creation is happening.
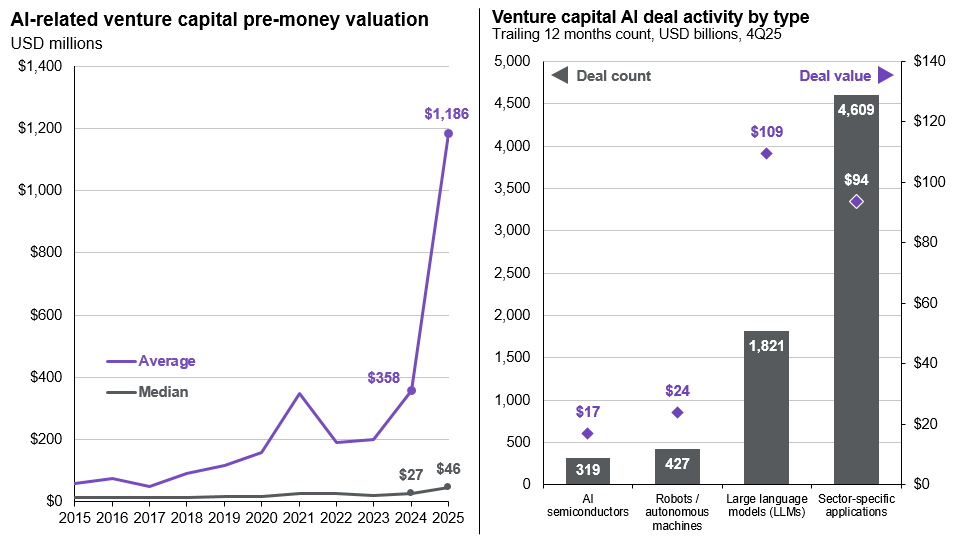
2025 was a record year for AI deal activity, capturing 65% of venture capital, but half of that went to just 0.05% of deals.17 Individual funding rounds have reached historic proportions. If the three largest AI names (Open AI, Anthropic and SpaceX/xAI) were public today, they would rank among the largest 25 in the S&P 500.
While the VC market is functioning well for a narrow set of proven AI names, the environment for everyone else—non-AI startups, emerging managers, companies that raised at 2021 valuations, LPs waiting for distributions—remains difficult. With nearly $300 billion in dry powder chasing relatively few opportunities names, investors run the risk of overpaying. Average AI pre-money valuations surged 231% last year to 1.2 billion.
Several dynamics worth noting:
- AI companies are faster to scale: Some AI-native companies are reaching $100 million in annual recurring revenue in just 12–18 months,18 milestones that historically took the median SaaS unicorn 8–10 years to achieve.19
- Private for longer: Roughly 40% of private unicorns are now more than 10 years old, and 41% haven’t raised since at least 2022. With the depth of private capital, fundraising needs no longer lead to an IPO.
- IPOs remain selective: 17 unicorns went public in 2025, but despite initial fanfare, most traded well below their first-day closing price by year-end. 2026 could see a few breakout IPOs, but public listings will likely remain selective.
- AI startups are major acquirers: Well-funded AI startups (not just Big Tech) accounted for a third of all VC M&A deals in 2025.
- Application layer sees momentum: Sector-specific startups developed at a fraction of the cost of horizontal foundation models continue to gain traction across healthcare, legal and robotics, as enterprise AI spending has scaled from $1.7 billion to $37 billion in two years.20
Private markets now total close to $20 trillion, and that depth of capital is changing when and whether companies go public at all. The number of U.S. publicly listed companies has fallen from 8,000 in 1997 to fewer than 5,000 today, and a growing share of technology value creation is being captured before it ever reaches public investors.
For investors, the question is less about picking the right AI name and more about whether their portfolio construction reaches where value creation is increasingly happening. Venture capital, private equity and infrastructure allocations offer one path. That said, valuations in private AI are running hot, liquidity is limited, and capital concentration means the gap between winners and losers could be wide. Selectivity matters as much as access.
Private AI companies are growing to historic proportion
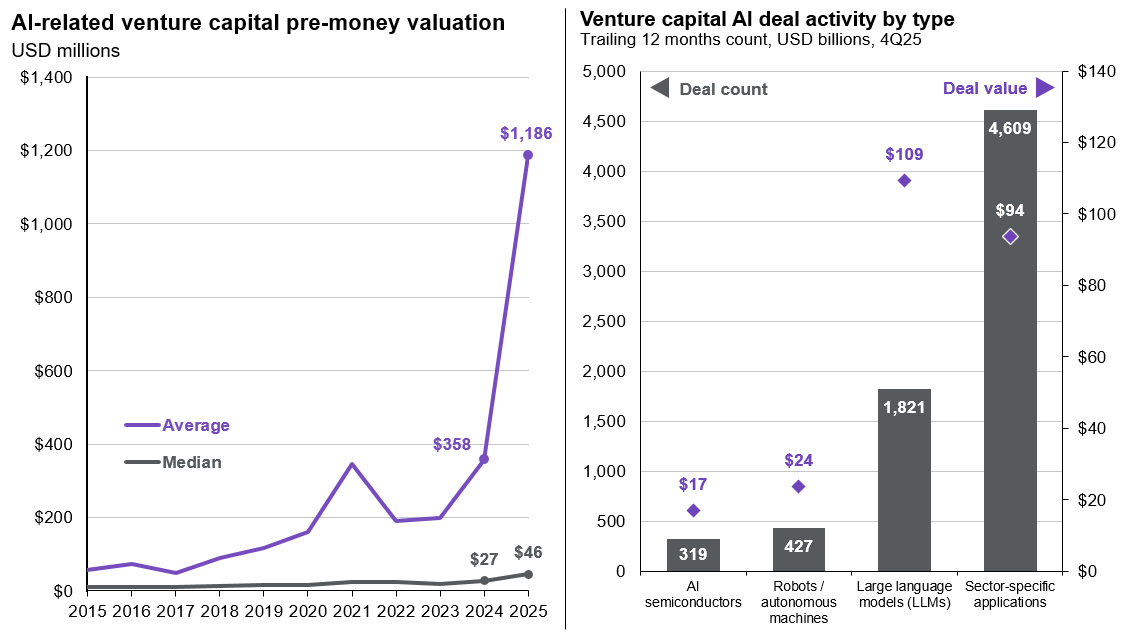
Source: PitchBook Data, Inc, J.P. Morgan Asset Management.
(Right) AI-related includes deal value for AI and Machine Learning (ML)-related deal activity. North America does not include Mexico.
Data are based on availability as of February 28, 2026.
17 PitchBook, January 2026.
18 Examples include Lovable, Cursor, OpenAI and ElevenLabs.
19 Bessemer Cloud 100 Benchmarks.
20 Menlo Ventures, “2025: The State of Generative AI in the Enterprise.”
AI Presentation
Latest Insights
206c164a-6480-11ee-8fe5-9dc5c8727cb0