


David Kelly
Chief Global Strategist
Published:
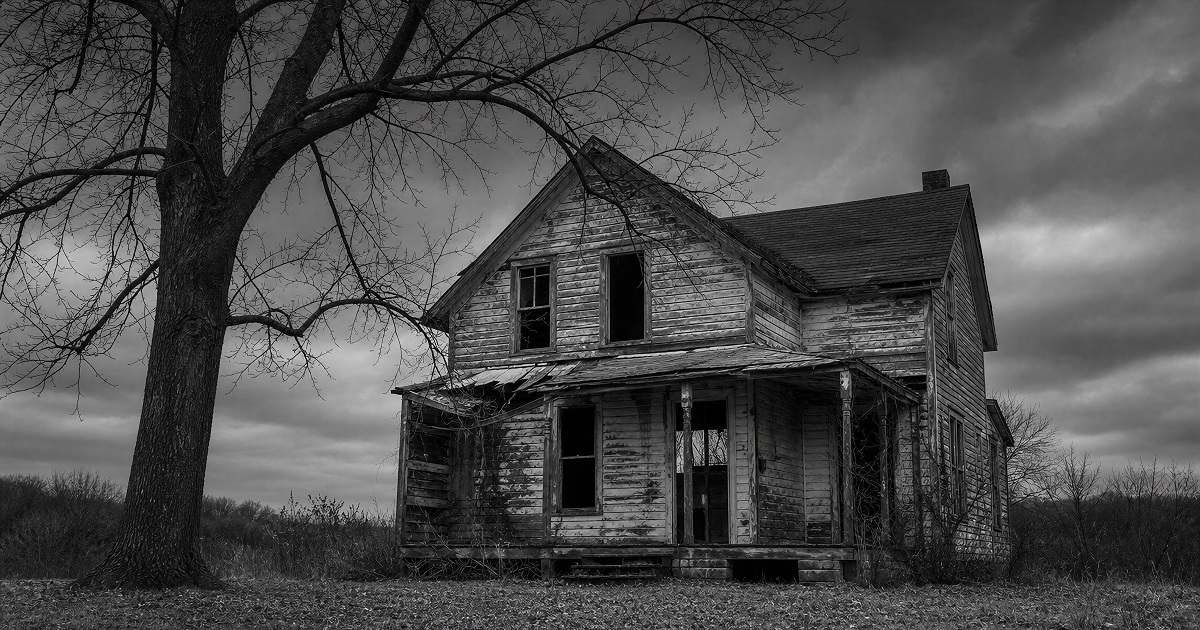
The housing market is haunted. It’s haunted by the legacy of too-easy monetary policy for well over a decade which allowed prices to vault higher in the post-pandemic boom. It’s haunted by tariffs and immigration policies that are simultaneously raising the cost of home-building and limiting population growth and, thus, the demand for new housing. And it’s being haunted by the Fed, whose attempts to manipulate the economy are shrugged off by almost all other sectors, leaving housing alone in its vulnerability to rate swings.
As a result, home sellers are seeing a sluggish market, with little appreciation in the last few years and slow traffic of potential homebuyers.
Many home buyers, particularly young home buyers, feel that they are priced out of the market by high prices, high mortgage rates and tough lending standards, and,
Home builders are being squeezed by rising costs for labor and construction materials, even as the demand for their products has dwindled.
Over time, stagnant home prices, stable mortgage rates and a steady rise in per capita income should bring about a more balanced market. However, as is always the case with housing, the pace of healing will be slow.
For financial markets, there is a silver lining in housing’s woes as they are restraining economic growth and inflation in the face of the AI boom, as will likely be made clear this week’s 3Q2026 GDP report. This, in turn, should be enough to convince the Fed to stay on hold on Wednesday and, perhaps, raise interest rates just one more time in the current tightening cycle.
However, for society, this is only a silver lining in a generally gloomy sky. There is a decline in homeownership that is accentuating the K-shaped nature of our economy, simultaneously postponing the reasonable aspirations of young people to be able to marry, settle down and build a family in their own home and undermining the middle class that had, for many decades, been the backbone of American economic progress and political stability.
The Demand for Housing
There is little doubt that housing demand is weak today.
One of the most direct measures is the reported traffic of potential homebuyers from a survey conducted by the National Association of Homebuilders. In early October, this diffusion index fell to 18, its lowest level for any month in almost 15 years. The home ownership rate, which had recovered from a post-GFC low of 63.1% in 2Q2016 to 66.0% in 2Q2022, has fallen back to 65.2% in 2Q2026, with a much sharper recent decline for those under age 35.
This weakness in housing can be ascribed to three broad forces: affordability, credit standards and demographics.
On affordability, the major pain point has recently switched from prices to interest rates.
On prices, the picture is actually better from a buyer’s perspective and worse, from a seller’s perspective, than a few years ago.
Looking at the average price of new homes, the median price of existing homes, and the FHFA and Case-Shiller indices of repeat sales, home prices soared by between 35% and 42% in the three years ending in 2022 but have only seen increases ranging from -3% to +15% over the past four years. Meanwhile per capita disposable income has risen by 23% over the past four years, increasing affordability from a price-to-income perspective. Indeed, relative to income per household, both median and average new home prices are now well below their historical averages.
In addition, while the last four years have seen relative stagnation in home prices, they have seen the exact opposite in stock prices, with the S&P500 registering a total return of 131% in the four years ending on October 12th, 2026. For those homebuyers who either had money in equities themselves or who are the beneficiaries of generous relatives, down payments have become less onerous.
Unfortunately, for home buyers this moderation in home price appreciation has coincided with a sharp rise in mortgage rates, with the 30-year fixed rate mortgage rate rising by more than 1% over the past year.
That being said, it should be noted that the current rate on a 30-year fixed rate mortgage, at 7.32% last week, is not particularly high by historical standards. It has actually averaged 7.68% over the past 50 years and 7.60% in the 20 years before the Great Financial Crisis.
Nor is there anything particularly unusual, from a historical perspective, in the relationship between inflation and the federal funds rate, the slope of the yield curve or the spread between mortgage rates and Treasuries. Over the past 50 years, the federal funds rate has averaged 1.00% above year-over-year core CPI inflation, 10-year Treasuries have yielded 1.15% more than the federal funds rate and the mortgage rate has averaged 1.82% above 10-year Treasuries. In October, we estimate that these numbers will average 1.13%, 1.25% and 2.22%, respectively, with investors getting average compensation for inflation, duration risk and the credit risk involved in home lending.
Of course, this is all very different from the period between the start of the Great Financial Crisis and the end of the pandemic. Over those 14 years, from January 2008 to December 2021, 30-year fixed rate mortgages rates averaged just 4.15% as the Federal Reserve largely held the federal funds rate below the rate of inflation and compressed mortgage spreads through the purchase of mortgage-backed securities.
However, it is important to recognize that this period was the anomaly, rather than today. Consequently, there is little reason to believe that mortgage rates will fall much below 7.0% in the months or even years ahead, in the absence of a recession.
Credit standards have also returned to their normal levels for the period before the housing boom and bust of the first decade of this century. Painful as this is for borrowers, it is probably the right thing for homeowners in the future as it should reduce the number of foreclosures and diminish the risk that families who are not in a fit financial condition to buy a house bid up prices on everyone else. This, also, is unlikely to change soon.
Finally, there is demographics.
In the first 20 years of this century, the U.S. population grew at an average pace of 2.4 million people per year, comprised of a natural increase, (that is to say, births minus deaths) of 1.5 million people and net immigration of 900,000 per year.
The natural increase collapsed during the pandemic but has since recovered. However, because of the aging of the population and declining birth rates, it peaked at 520,000 in 2025 and has since likely resumed a steady decline.
Meanwhile, the last two years have seen a dramatic swing in migration. While the government has stopped publishing timely data on legal immigration, illegal immigration has essentially come to a halt and we estimate that deportations are now almost cancelling out the impact of positive, but diminished, legal net immigration. Regardless of the outcome of the midterm elections, we expect U.S. immigration policy to stay on roughly the same track for at least the next two years, since the enforcement of immigration policies is largely in the purview of the administration and Congress and the administration are unlikely to agree on a much-needed immigration reform bill. Given all of this, we expect annual U.S. population growth of just 800,000 over the next few years. With an average household size in the U.S. of roughly 2.5 persons, this implies a demographic need for just 320,000 new housing units per year going forward compared to roughly 1,000,000 per year in the first two decades of this century.
The Supply of Housing
This suggests that we are still in a situation of net excess supply across the economy.
With nine months of data in the door, we believe that 2026 will see total housing starts of 1.320 million units, comprised of 896,000 single-family units and 424,000 multi-family units. This would be the weakest overall level of housing starts since 2019.
Even with this, the stock of available units should see substantial growth. Between the second quarter of 2024 and the second quarter of 2026, the U.S. housing stock rose by 2.814 million units, while total housing completions equaled exactly 3.000 million units, implying the removal of just 100,000 units from the stock each year through fires, floods and teardowns.
Over the past four years, the rental vacancy rate has risen from 5.6% to 7.3% while the homeowner vacancy rate has climbed from 0.8% to 1.2% over the same period. Even if housing starts were to drift down further over the next few years, given our very weak demographics, vacancy rates would likely continue to drift up, holding a lid on home price increases and rents.
Some further increase in supply will come from the gradual reduction in the number of properties effectively held off the market by the fact that they were financed by the super-low fixed-rate mortgage rates available between the financial crisis and the end of the pandemic. As noted in a recent Wall Street Journal article1, there were almost 15 million primary mortgage loans with rates under 3.0% at the end of 2021 – by this July, this number had fallen below 12 million.
For builders, weak demand is just one side of an unhappy squeeze play. Construction workers are hard to find and wages in the industry are rising faster than elsewhere partly because of the swing in immigration and the demand for workers from the buildout of datacenters and associated infrastructure. Meanwhile, the cost of building materials has been boosted by tariffs and the same surge in infrastructure demand. On top of this, rising interest rates is increasing the cost of working capital for builders. All of these forces will make it difficult for home-builders to cut prices. However, it should also discourage new construction. As a consequence, we expect housing starts to drift down going forward, with 2026 starts of 1.32 million units falling to 1.24 million units in 2027 and lower still in 2028.
Investment Implications
Residential construction in the second quarter amounted to $1.182 trillion, just 3.6% of nominal GDP. A further drift down in homebuilding will drag on economic growth both directly and in a diminished demand for the furniture and appliances with which consumers fill their homes. However, unlike the situation in 2008, financial markets are not threatened by huge derivative bets on housing or the prospect of a surge in foreclosures due to lax underwriting standards. In addition, the weakness in housing demand may not result in much further downward pressure on inflation as higher mortgage rates may force some potential home-buyers to continue to rent, allowing for continued, albeit low, increases in rental rates, which will feed through to the government’s measures of rent and owners’ equivalent rent.
We don’t expect the Fed to raise interest rates this week given the proximity of next week’s midterm elections. However, even if they do raise rates in December, as we anticipate, that could be the extent of tightening for this cycle because of the weakness in housing. This weakness could also cause the Fed to delay any direct action to reduce its still $1.9 trillion in mortgage backed securities.
For investors, after a bad year for the bond market, this suggests a period of solid and stable returns for high-quality fixed income. There will also continue to be plenty of regional opportunities for housing growth even in a sluggish national market. However, for many home sellers, home buyers and home builders, housing remains haunted for now with many personal housing nightmares to be endured before housing, once again, can be the foundation of the American dream.