
Sovereign policy will be vital in determining our success or failure in tackling climate change, particularly in China, the US and the European Union (EU), which account for the majority (50%) of global emissions.
For sovereign investors, there is no unified standard for sovereign emissions reporting for investment portfolios, despite the relevance and scale of the sovereign bond market.
Industry standardization can improve with technological advances and greater availability of open-source data.
Investment policies should also acknowledge trade-offs in choosing data, avoid being regressive, and incentivize a positive policy trajectory.
The complexities of sovereign emissions accounting
It is evident that a country’s emissions are a key consideration in assessing the environmental standing of a sovereign issuer. However, there is currently no unified standard for sovereign emissions reporting for investment portfolios.
Sovereign emissions are estimated by scientists, primarily by looking at energy balances across different economic activities and multiplying these balances with estimation factors from the 2006 IPCC Guidelines for National Greenhouse Gas Inventories. Land use, land use change, and forestry are not always included in sovereign emissions as they are technically complex and heavily debated: deforestation or conversions of natural lands and waters can release stored carbon, especially when burning is involved, whereas reforestation and conservation practices can improve carbon sinks locally. Offsets for carbon sinks can be estimated using land cover data and are often reported separately.
There are a few different major sources for estimations of sovereign emissions. Some countries report their own emissions estimates, referred to as nationally determined contributions (NDCs). NDCs pose a challenge for cross-country comparison as they are not broadly available for all countries. They also create potential conflicts of interest as they are self-reported by government officials.
Beyond NDCs, public and private organizations have created databases with comparable cross-country data. Most databases ultimately refer back to the same primary sources: the International Energy Association (IEA), British Petroleum Statistics (BP), and the Food and Agriculture Organization of the United States (FAOSTAT). The IEA offers broader country coverage than BP, but its data is not freely available for the most recent three years. FAOSTAT primarily covers GHG emissions from agriculture and related land use. EU EDGAR and Global Carbon Project refer to these sources, with additional estimations for recent years or trade effects (Exhibit 1).
Exhibit 1: Sovereign emissions by greenhouse gas type
Emissions – which data source should we use?
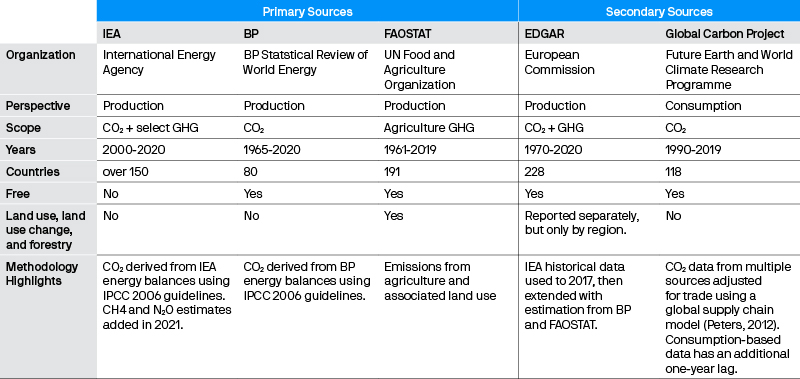
Source: J.P. Morgan Asset Management; As of June 2022.
Different approaches to measuring sovereign emissions
The GHG protocols (scope 1, 2, 3) set for corporate carbon accounting do not apply to sovereigns. Instead, the Partnership for Carbon Accounting Financials (PCAF) has proposed multiple potential approaches that can be summarized as involving four key decisions: CO2 vs. total GHG; consumption vs. production; territorial vs. bottom up; per GDP vs. per capitai
1. CO2 vs. total GHG
Carbon emissions represent 75% of global GHGs. The bulk of these emissions come from burning fossil fuels. While other GHGs are highly relevant for global warming, estimation uncertainties and data availability present challenges (Exhibit 2).
Exhibit 2: Sovereign emissions by GHG type
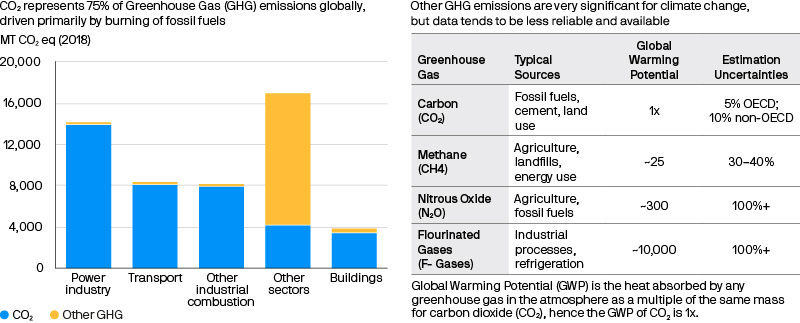
Source: EU EDGAR 2021 Report. Other sectors include primarily agricultural activities. Does not include land use, land use change and forestry.
Currently available estimates of total GHGs are also highly correlated to CO2 emissions (Exhibit 3). Exceptions include countries such as Brazil and Indonesia that see higher methane from agricultural activities.
Exhibit 3: Different approaches to emissions can result in similar high-level country comparisons, but there can be large difference for some countries
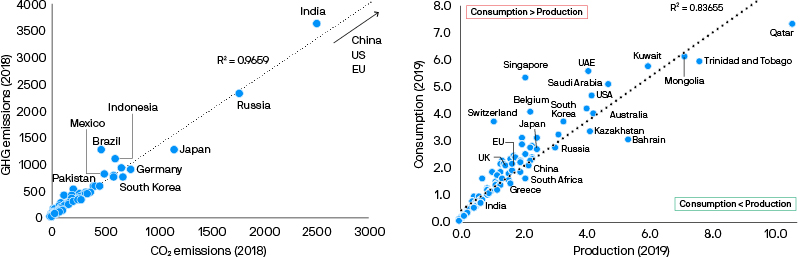
Source: EU EDGAR 2021 Report. Global Carbon Project April 2022
2. Consumption vs. production
Ideally, emissions should account for carbon leakage – for example, Mongolia should not bear full responsibility for coal exports that are ultimately consumed in China. Consumption- based data adjusts for carbon leakage but relies on models to make these adjustments, and data availability is typically lower.
3. Territorial vs. bottom up
Most emissions data today is territorial, counting emissions produced (and possibly consumed) within national boundaries. This approach can lead to some double counting of private sector emissions.
Another approach is a bottom-up method, where emissions are calculated at the government and private sector levels and then summed. This approach allows for a much more nuanced view of a country’s emissions, is more analogous with the GHG corporate protocol, and avoids the double counting problem. However, data availability can be quite limited for a bottom-up approach.
4. Per GDP vs. per capita
The unit of normalization for assessing carbon intensity is also a source of debate. The most commonly used approaches are emissions per GDP and emissions per capita (population adjusted). Per GDP is more analogous to the corporate approach of emissions per unit revenue; however, the results tend to benefit larger developed markets vs. smaller emerging markets. The per capita approach mitigates some of this income bias effect.
Data availability limits some choices today as the most reliable data with broad country coverage is focused on carbon, production-oriented, and territorial. High-level country comparisons are generally similar regardless of source and approach, although normalization can have a bigger impact. For example, regardless of data source and approach, China and the US account for the largest proportion of absolute global emissions. However, China comes out as a top global emitter when looking at per GDP data but not when looking at per capita data. The opposite is true for the US (Exhibit 4).
Exhibit 4: Top emitters when normalized by population or GDP
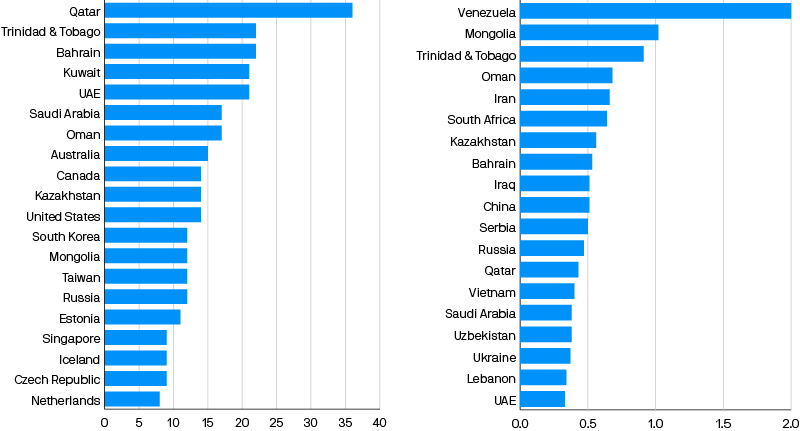
Source : EU EDGAR 2021 Report.
Future of emissions data
We believe industry standards will develop further as technology enhances the availability of open-source data.
Technology will improve global measurability and accountability for emissions. Produced or territorial emissions from sovereigns can be measured and monitored from the ground, the air (drones or airplanes), or space. Gas emissions can be monitored by changes in their concentrations in the atmosphere.
While a station on the ground can monitor local emissions, requiring many sensors distributed around the country (the current approach for air quality), an airplane or drone can monitor emissions along a flightpath. In the future, sensors could provide continuous regional monitoring of methane, nitrous oxide, and fluorinated gases (F-gases), particularly at locations that are known sources. Sensors have been used in the past to create inventories of F-gases and quantify methane emissions from agriculture and leaking oil and gas infrastructure. Station and airborne monitoring advances will improve data significantly – but countries will still need to submit to GHG monitoring.
Satellite technology can also allow monitoring from space. Present methodologies are not precise enough to monitor source locations from CO2. However, other GHGs can be monitored due to their lower concentrations in the atmosphere and distinct radiative properties.
Methane has been a major focus in the last decade for its abundance where organic matter decomposes (landfills, agriculture practices) and in leakage from the oil and gas industry. Historically, methane monitoring satellites were built and launched by government science agencies such as the European Space Agency and Italian Space Agency, but a new set of satellites for Earth monitoring is being deployed by nonprofits and corporations. For example, MethaneSAT, a subsidiary of the Environmental Defense Fund, is on schedule to launch its methane monitoring satellite after October 1, 2022. The satellite will be capable of identifying sources of methane and will be free and open source.
Satellites belonging to GHGSat, a Canadian satellite company, have also been used to identify leaks in oil and gas infrastructure. Finally, satellites can help quantify sovereign changes in land cover and forest density, identifying reductions in major carbon sinks. Voluntary carbon registries such as Verra are even developing protocols including satellite data.
Considering emissions data in investment policies
Today, investors interested in incorporating emissions data in their investment policies need to be aware of the limitations in data availability and make choices that align with their goals.
Clarifying the objective is an important first step in determining which data to use. Is the objective to lower risks because emissions regulation and divestments may hurt the creditworthiness of a high emission sovereign? Or is the objective to help finance and incentivize energy transition? If the latter is the goal, investors should be wary of using indicators with an income bias, such as emissions per GDP, which might discourage investment by poorer countries in the energy transition.ii
The Paris Agreement and pledges around COP26 call for an investment of USD 100 billion per year from rich countries toward poor countries to help mitigate the impact of climate change.iii Supporting issuance of green and sustainable bonds can be one way for investors to participate in this pledge. Incorporating forward-looking information incentivizes a positive policy trajectory. Investors can consider net zero or carbon neutrality pledges and related policies, whether those policies are enshrined in law, and whether there is reliable reporting (Exhibit 5).
Exhibit 5: Net zero pledges
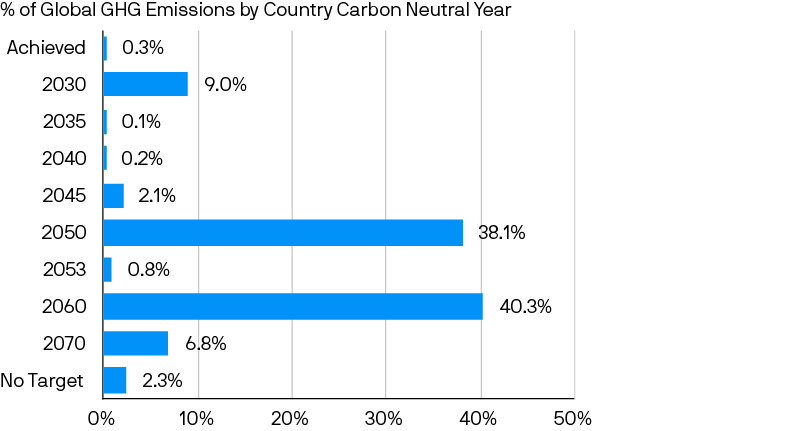
Source: NetZeroTracker; data as of April 2022.
It is also key to consider whether countries are following through on their pledges. One way to gauge this is by looking at investment in renewables. While China has the highest absolute emissions of any country, it has also invested over USD 1 trillion in energy transition projects (renewables and industrial logistics) since 2014, dwarfing efforts by any other country (Exhibit 6).
Exhibit 6: Energy transition investment
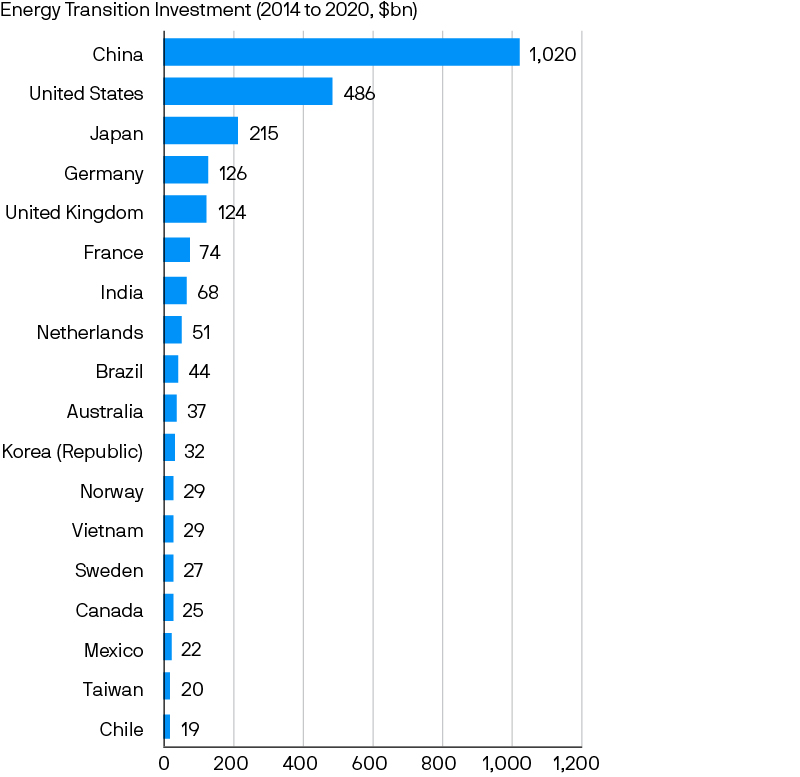
Source: Bloomberg; data as of July 2021.
Additional forward-looking trackers are also available for developed countries (Exhibit 7). The Climate Action Tracker (CAT) is one of the most followed sources and provides a simple overview of whether countries’ climate change policies and actions are compatible with the Paris Agreement. Ratings are accompanied by analysis on where further progress is needed, which can be useful third-party information to refer to when engaging with sovereigns.
Exhibit 7: Forward-looking climate policy trackers
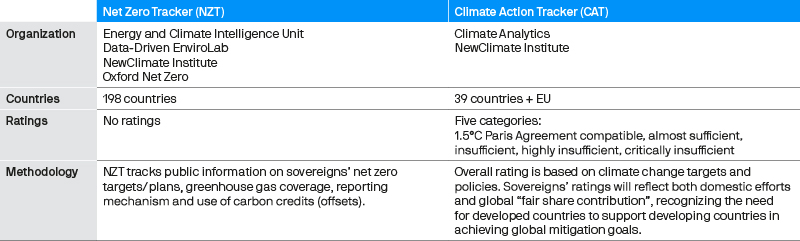
Source: J.P. Morgan Asset management; As of 2022
Conclusion
Emissions data is being more widely evaluated than ever by regulators and by investors interested in mitigating risk and/or making an impact. Understanding how sovereign emissions are estimated, what the current data can and cannot tell us, and the possibilities for the future is becoming part of a foundational ESG toolkit for sovereign investors.
Policymakers should prioritize making better emissions data freely available to improve global accountability and decision making. This will also improve transparency and comparability in climate- related disclosure in investment portfolios. By pushing for better disclosures and reflecting emissions data in their investment decisions, investors can help to drive the transition to a low- carbon world.
Additional forward-looking trackers are also available for developed countries (Appendix Exhibit D). The Climate Action Tracker (CAT) is one of the most followed sources and provides a simple overview of whether countries’ climate change policies and actions are compatible with the Paris Agreement. Ratings are accompanied by analysis on where further progress is needed, which can be useful third-party information to refer to when engaging with sovereigns.
i Draft new methods for public consultation – green bonds, sovereign bonds, emissions removal. Partnership for Carbon Accounting Financials (PCAF). November 2021
ii Sovereign ESG Investing: We can do better. Jean Pesme and Anderson Caputo Silva. June 2021.
iii The broken $100-billion promise of climate finance – and how to fix it. Jocelyn Timperly. October 2021
Other Sources
Carbon Disclosure and Climate Risk in Sovereign Bonds. Global Footprint Network. December 2016.
Accounting for Carbon: Sovereign Bonds. Trucost by S&P Dow Jones Indices. June 2018.
09pb222006100446