Slide Image
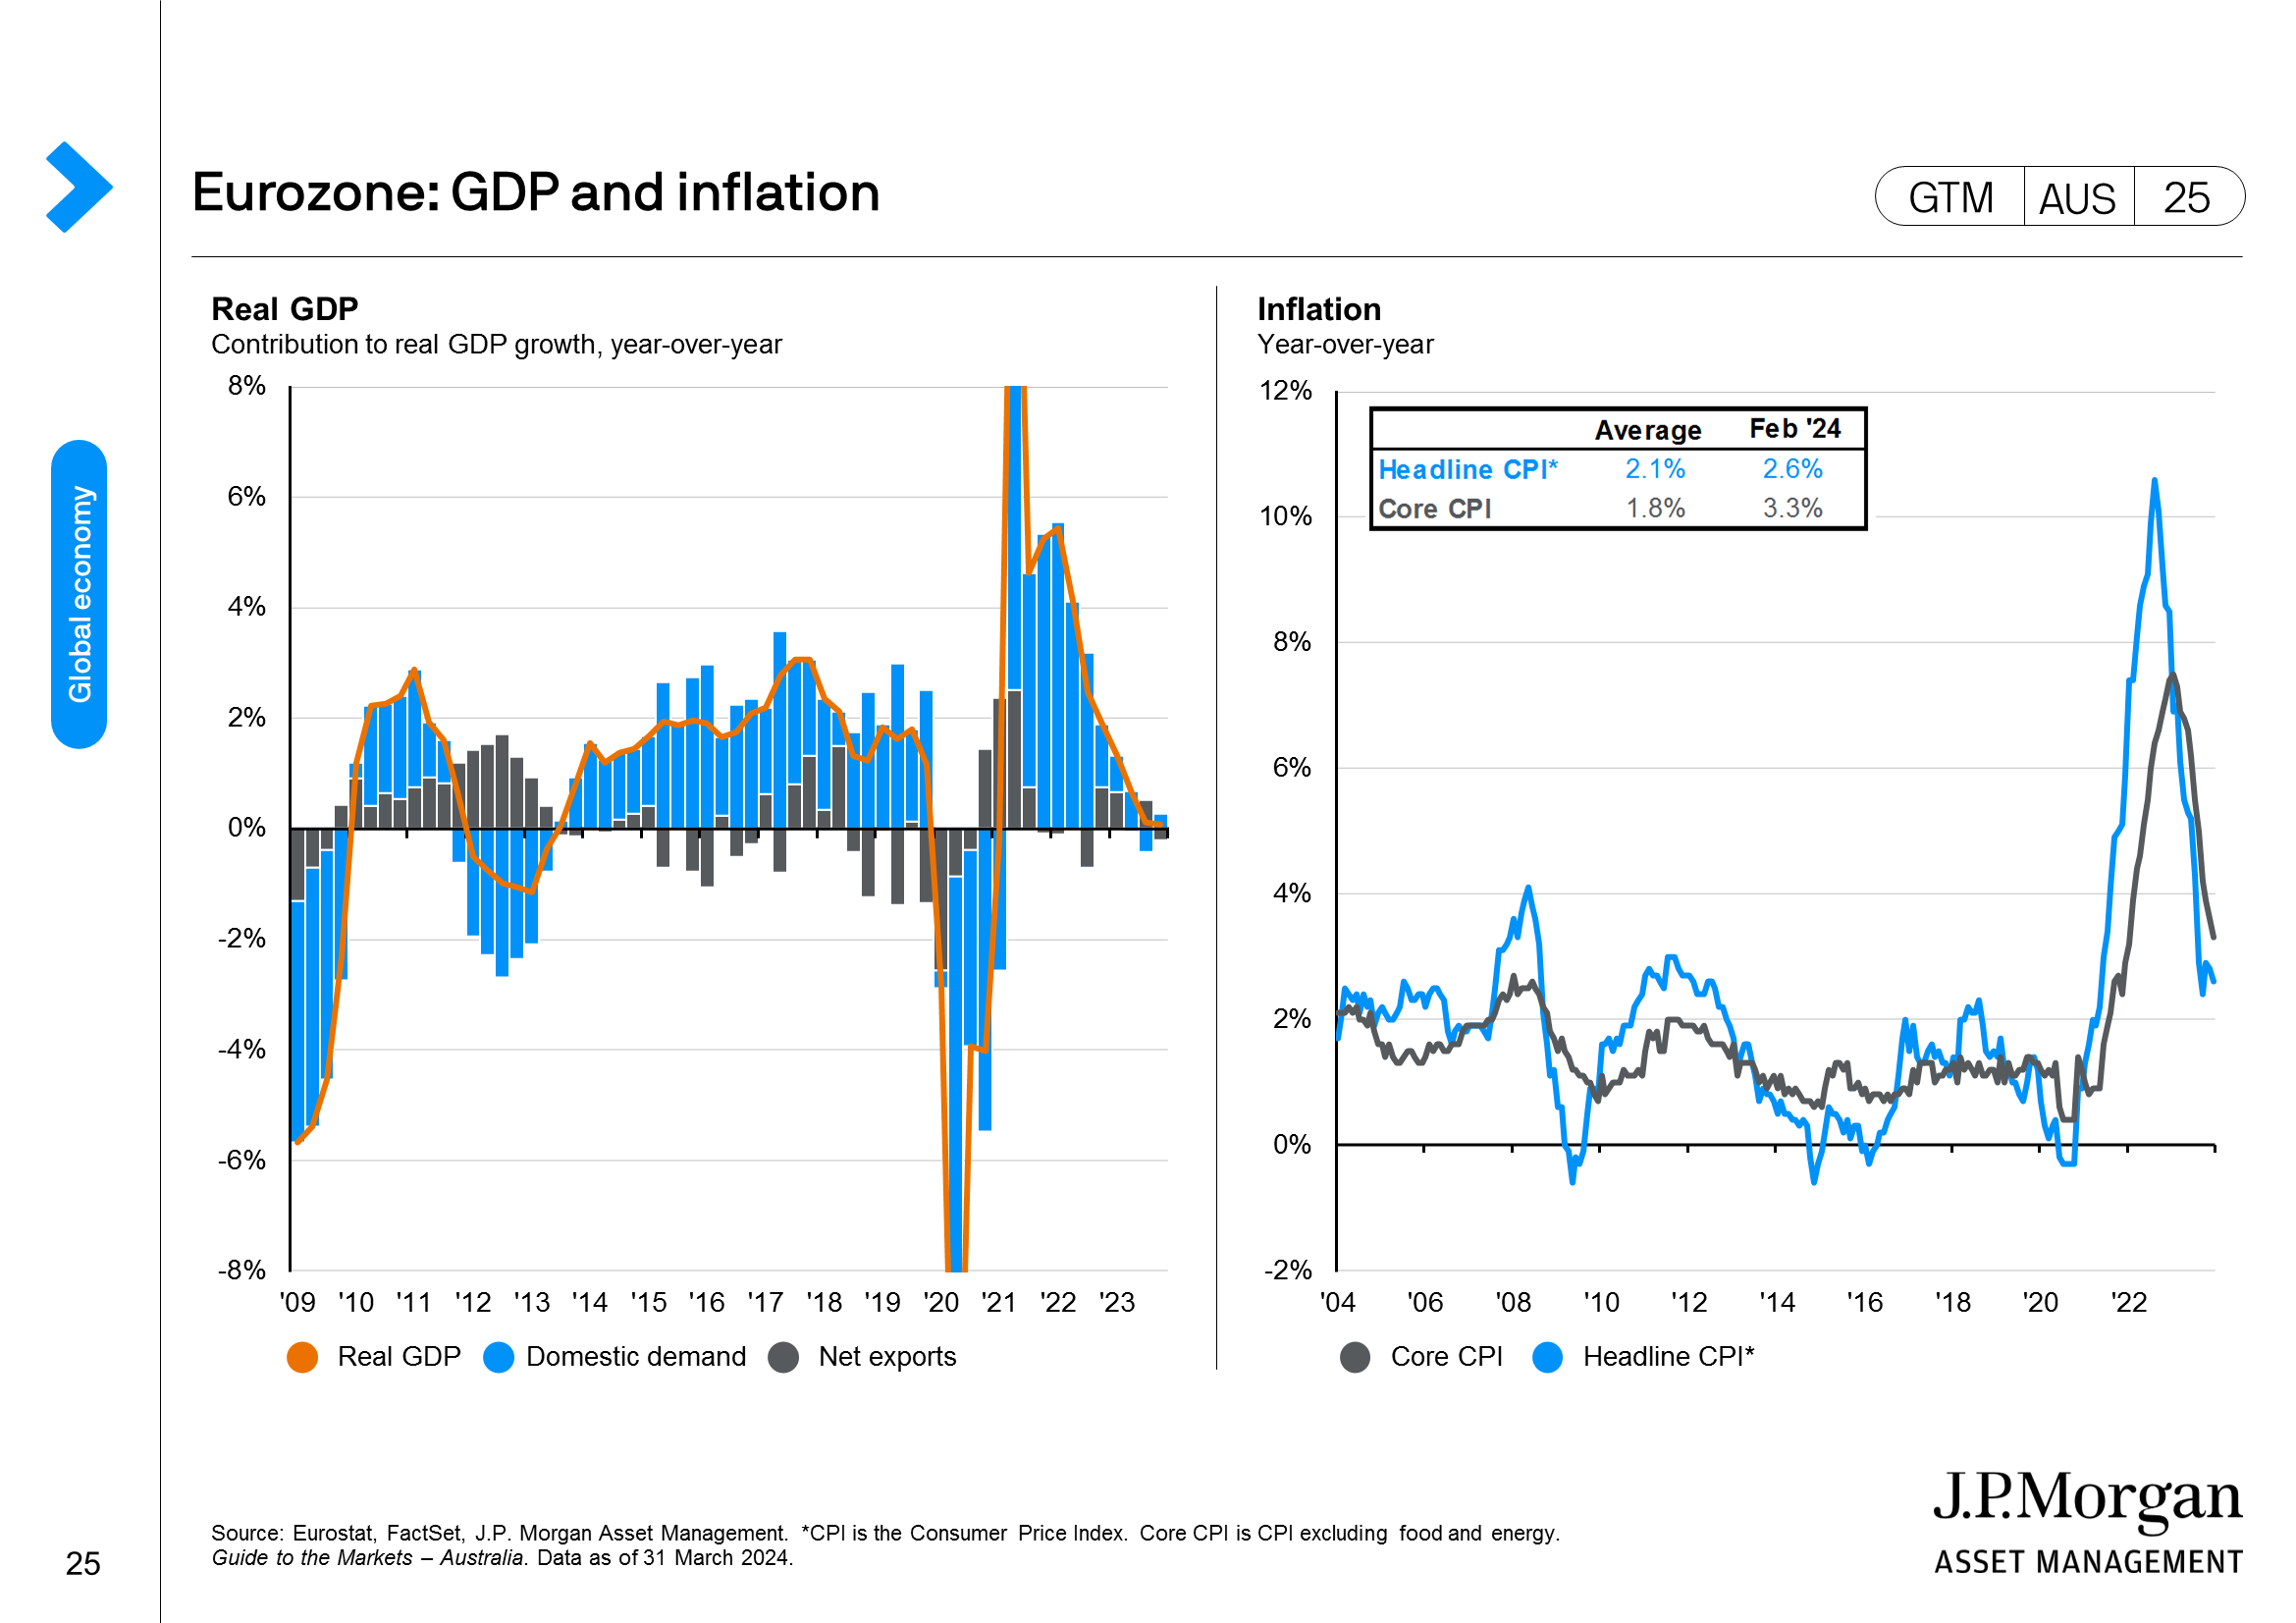
Chart Image
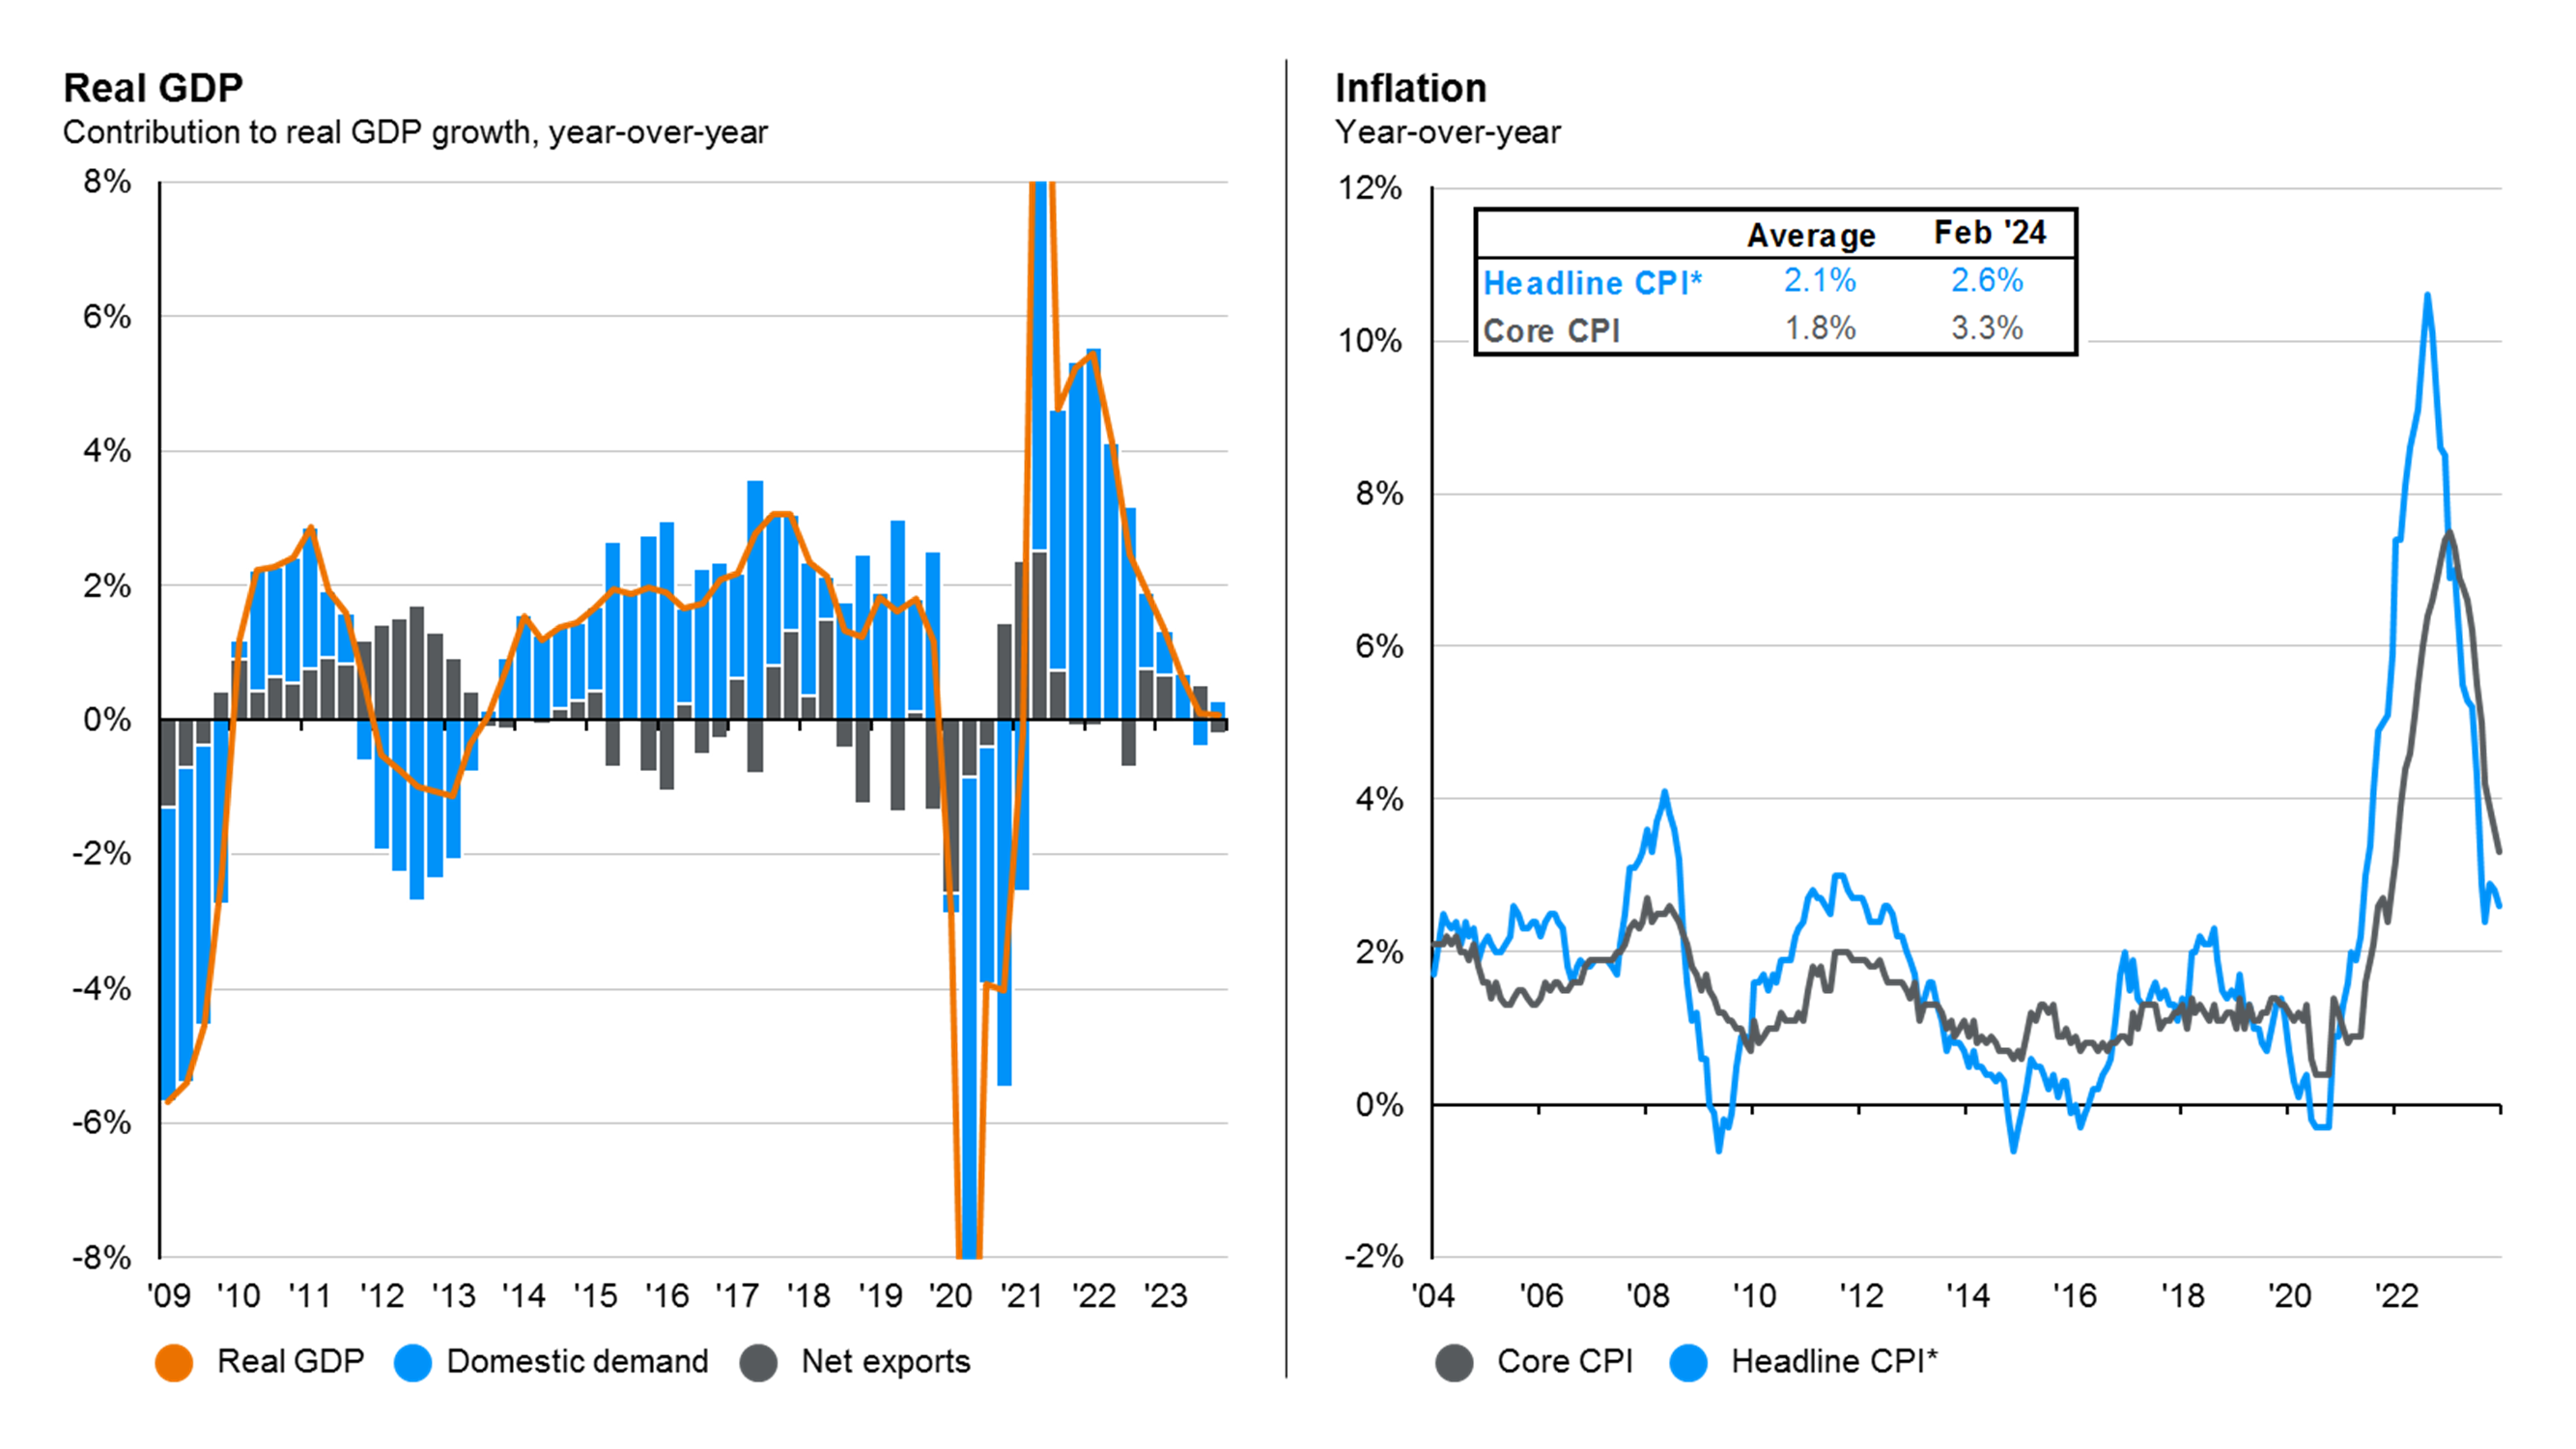
Eurozone: GDP and inflation
The left hand chart on this page shows the rate of growth in the eurozone economy compared to a year ago. The chart breaks down the contribution from domestic demand and international trade, or net exports. Inflation in the region has surged as energy prices have increased and headline inflation has outpaced core rates of inflation for the economy.