Slide Image
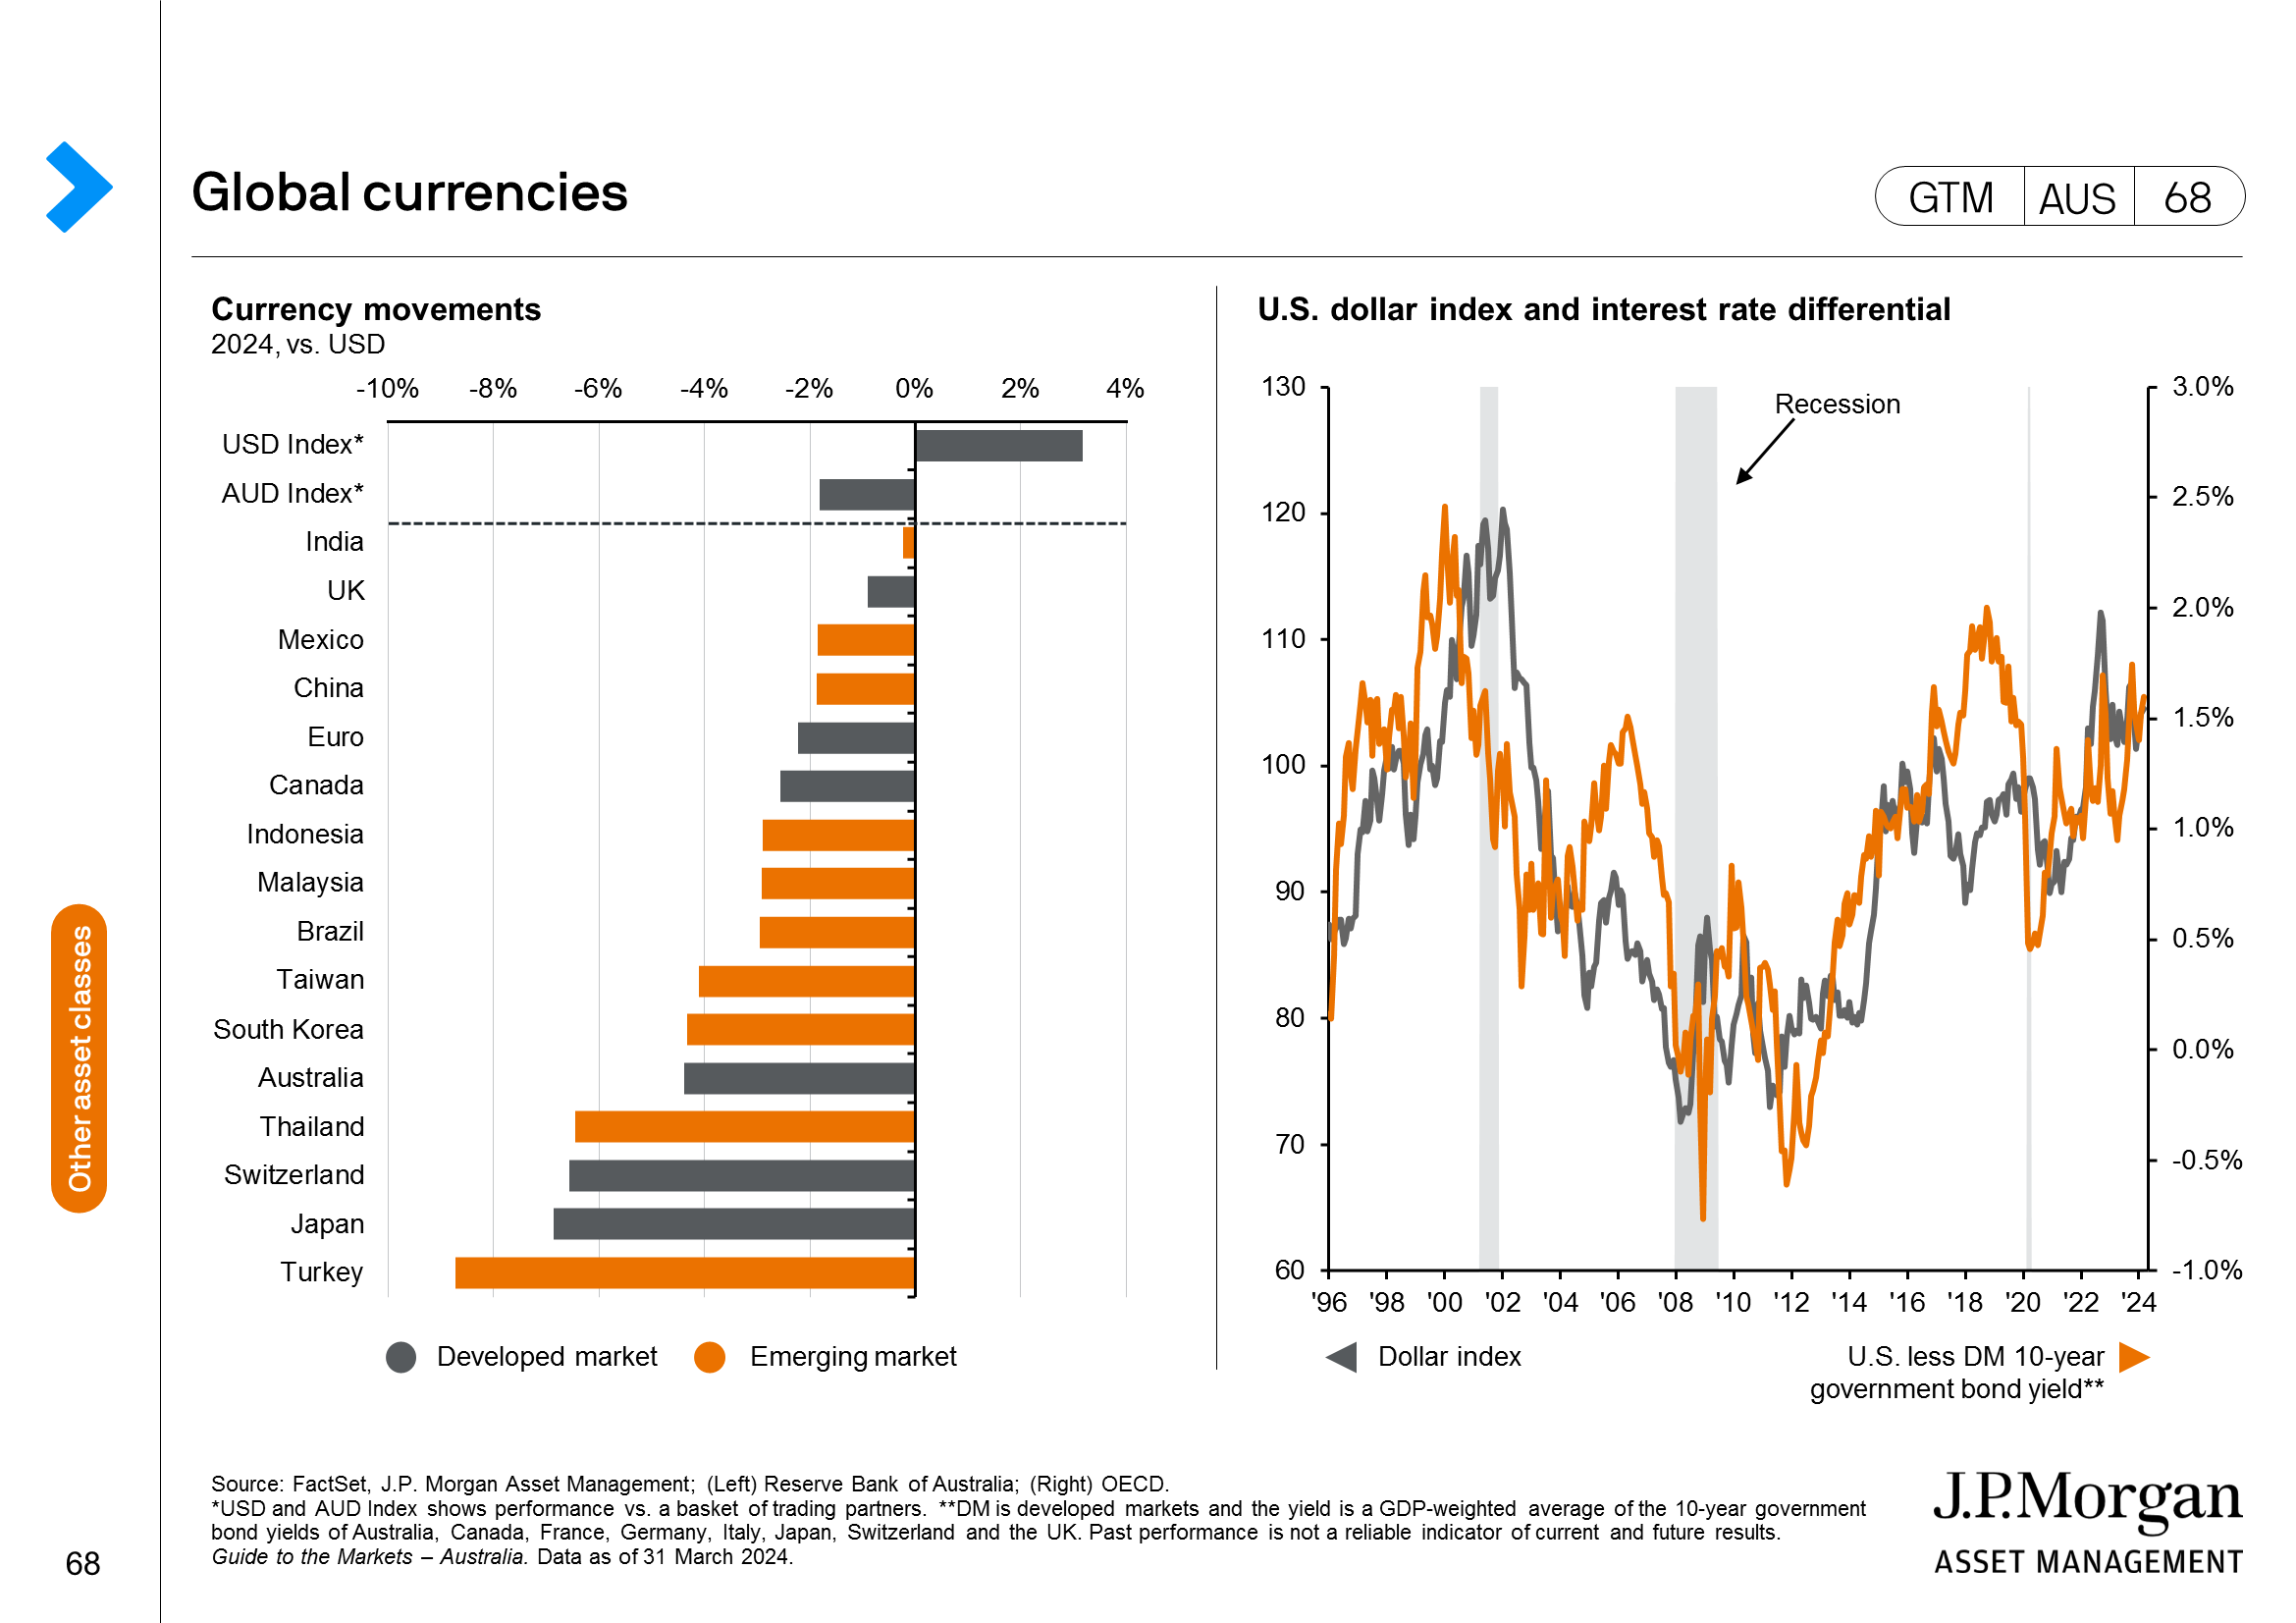
Chart Image
Global currencies
The left chart shows how currencies have performed this year against the U.S. dollar as well as the U.S. and Australian dollars' performance against a basket of currencies. The right hand chart shows the performance of the U.S. dollar represented by the U.S. dollar index and its relationship to yield differential between the U.S. and the rest of the world. The ability for money to earn a higher level of interest often affects the exchange rate by more money flowing to that market. A larger differential means more currency appreciation.