Slide Image

Drawdown dispersion and recovery rates
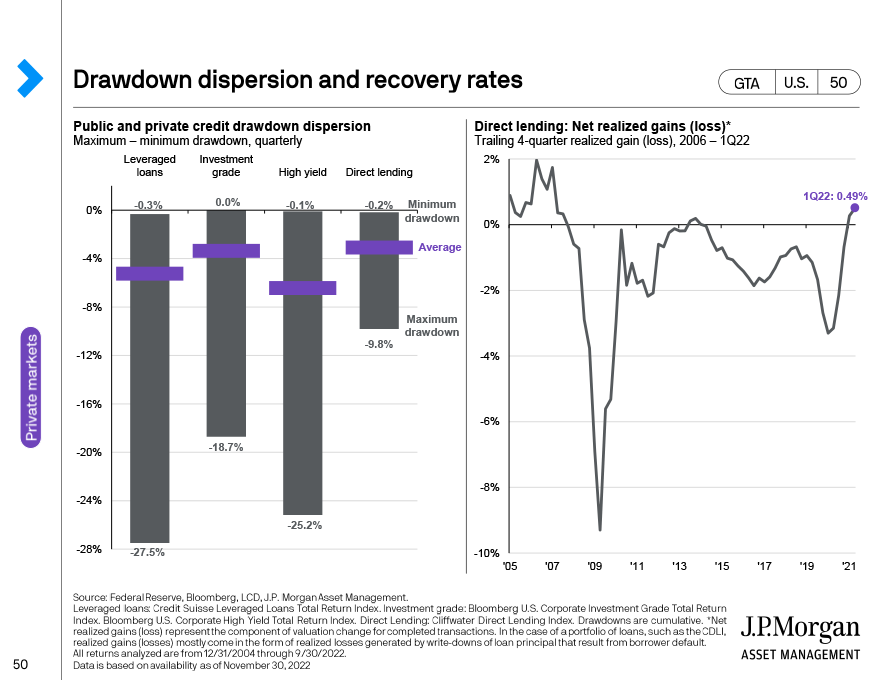
The left chart shows public and private credit drawdown dispersion. Compared to higher risk public credit, direct lending has a much tighter dispersion similar to that of Investment Grade.
The right chart shows the trailing 4-quarter net realized gain (loss) in direct lending. The periods of net realized gains can be split into 4 distinct periods. The first is 2004-2007, which is marked by sustained realized gains due to strong economic growth. The second is 2008-2010, during which 4-quarter trailing net losses peaked at 9.3% in 1Q10. The losses were primary driven by the 2008 Financial Crisis and the subsequent economic consequences. The third period is 2012 – 2019. The regime is initially marked by modest realized gains before the 2015 Oil Crisis resulted in net realized loss. The fourth period begins in March 2020 with the onset of COVID-19. 4-quarter net realized losses peaked at the end of 2020 at 3.3%.